Data Quality – A 5-Day Primer
This primer is designed for data analysts, engineers, and business leaders who want to understand and implement a modern data quality framework.
Day 1: Core Concepts
What is Data Quality?
Every insight, forecast, and decision your business makes depends on the quality of its data. When errors such as missing values, duplicates, inconsistent formats, or outdated records occur, business performance silently suffers.
Data quality is a measure of how accurate, complete, consistent, and useful data is for its intended purpose. Maintaining high data quality ensures that data is reliable and helps businesses make better decisions. It guarantees the data is correct, relevant, and ready to be used effectively for analysis, visualization, and reporting.
Good data quality helps businesses avoid costly mistakes, improve customer satisfaction, and drive operational efficiency. Conversely, poor data quality leads to incorrect conclusions, wasted resources, and negative business outcomes.
High-quality data is essential for organizations to meet a variety of requirements, including regulatory compliance, financial accuracy, operational efficiency, business growth, and customer satisfaction.
Data Quality vs. Data Observability
Data Quality focuses on the static characteristics of data: its accuracy, completeness, and consistency. It involves defining metrics on these attributes to determine the health of data for analytics, reporting, AI models, and other data products.
Data Observability actively monitors enterprise data pipelines, including ingestions, transformations, and logs, to detect anomalies in real time. This proactive monitoring helps ensure that Data Quality metrics are continuously met.
In essence, data quality assesses data at rest, while data observability focuses on data in motion. The former indicates the health of the current state of your data, while the latter helps prevent issues or trigger automated fixes (self-healing) to keep data within acceptable standards.
A key objective of Data Observability is to automate Data Quality activities to deliver Data Trust.
The Dimensions of Data Quality
The number of data quality dimensions has varied over time, with common models including 6, 8, or 10. Dimensions are classifications of data quality issues that businesses have observed and endured.
For simplicity, we will focus on the six core dimensions, while also explaining two common additions: Integrity and Relevancy.
The six core dimensions are Accuracy, Consistency, Completeness, Validity, Uniqueness, and Timeliness.
-
Accuracy Ensures that data accurately reflects real-world entities and is free of errors. For example, a customer's address in the database should match their actual physical address. Accurate data helps businesses generate dependable insights and make better decisions.
-
Consistency Ensures that data is uniform across all systems and datasets. For example, a customer’s name must be the same in both the billing and CRM systems. Inconsistent data can create confusion and erode trust.
-
Completeness Ensures all required data fields are populated. For instance, a sales record should include the product, customer, and transaction amount. Missing information can render data less useful and difficult to analyze.
-
Validity Ensures that data conforms to defined rules, constraints, and formats. For example, dates should be in a standard “YYYY-MM-DD” format, and phone numbers should have the correct number of digits. Invalid data can cause processing errors and slow down operations.
-
Uniqueness Ensures there are no duplicate records within a dataset. For example, each customer should have only one profile in the system. Duplicate records are misleading and lead to flawed analysis.
-
Timeliness Ensures that data is up-to-date and available when needed. For example, stock levels in an inventory system should reflect current quantities. Outdated data can lead to poor decisions and missed opportunities.
The following are often considered extended dimensions:
-
Integrity Ensures that data relationships are maintained and accurate across platforms by enforcing strict validation standards. For example, every
orderrecord should have a validcustomer_idthat corresponds to an entry in thecustomerstable. Broken data relationships lead to incomplete or incorrect insights. -
Relevancy Ensures that the data is appropriate and useful for a specific purpose. Essentially, it’s about having the right data for the right job. For a company aiming to improve its marketing strategies, sales data related to customer demographics and purchase history is highly relevant.
Understanding these dimensions is the first step. In the following sections, we will explore how to put them into practice using a modern data platform, Infoveave, to demonstrate a practical implementation.
Day 2: Setting Up Data Quality Rules
Prerequisite: Enriching the Data Catalog with GenAI
Before defining rules, it's best practice to ensure your data source is well-documented in the catalog.
-
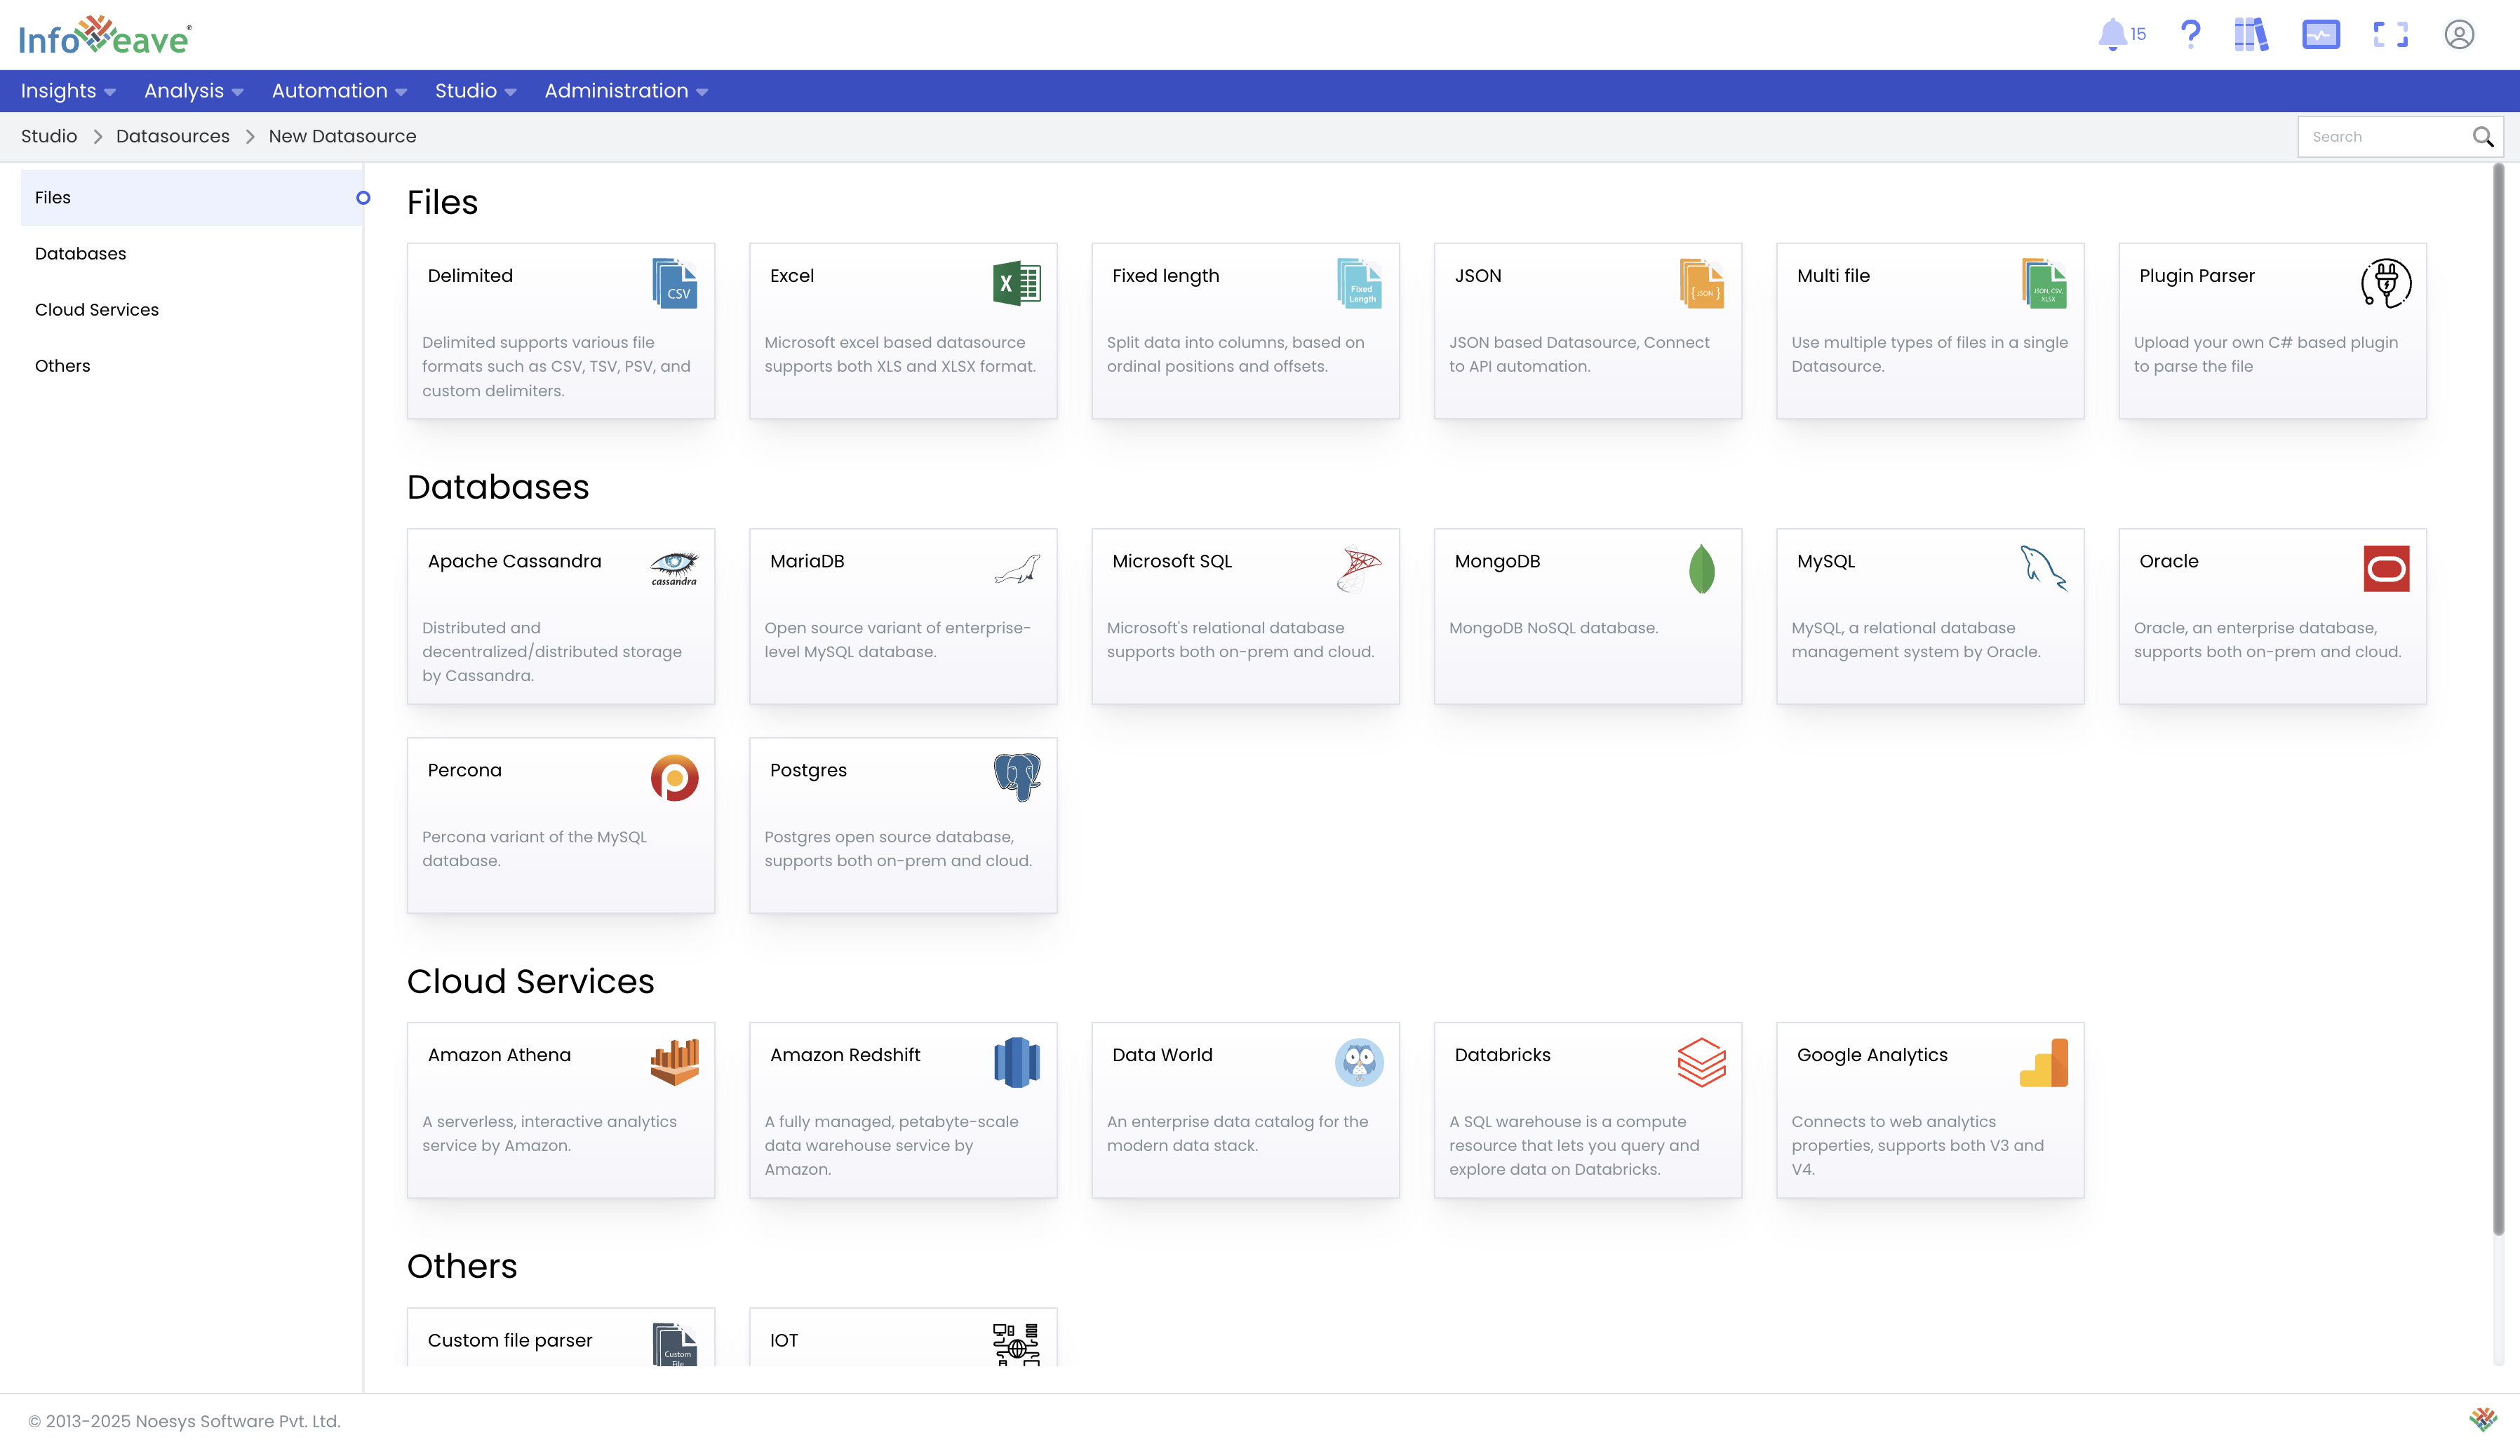
Create or Select a Data Source: Begin by creating a new data source for data quality evaluation or select an existing one. For this guide, you can use a pre-configured data source linked to a Sample excel file.
-
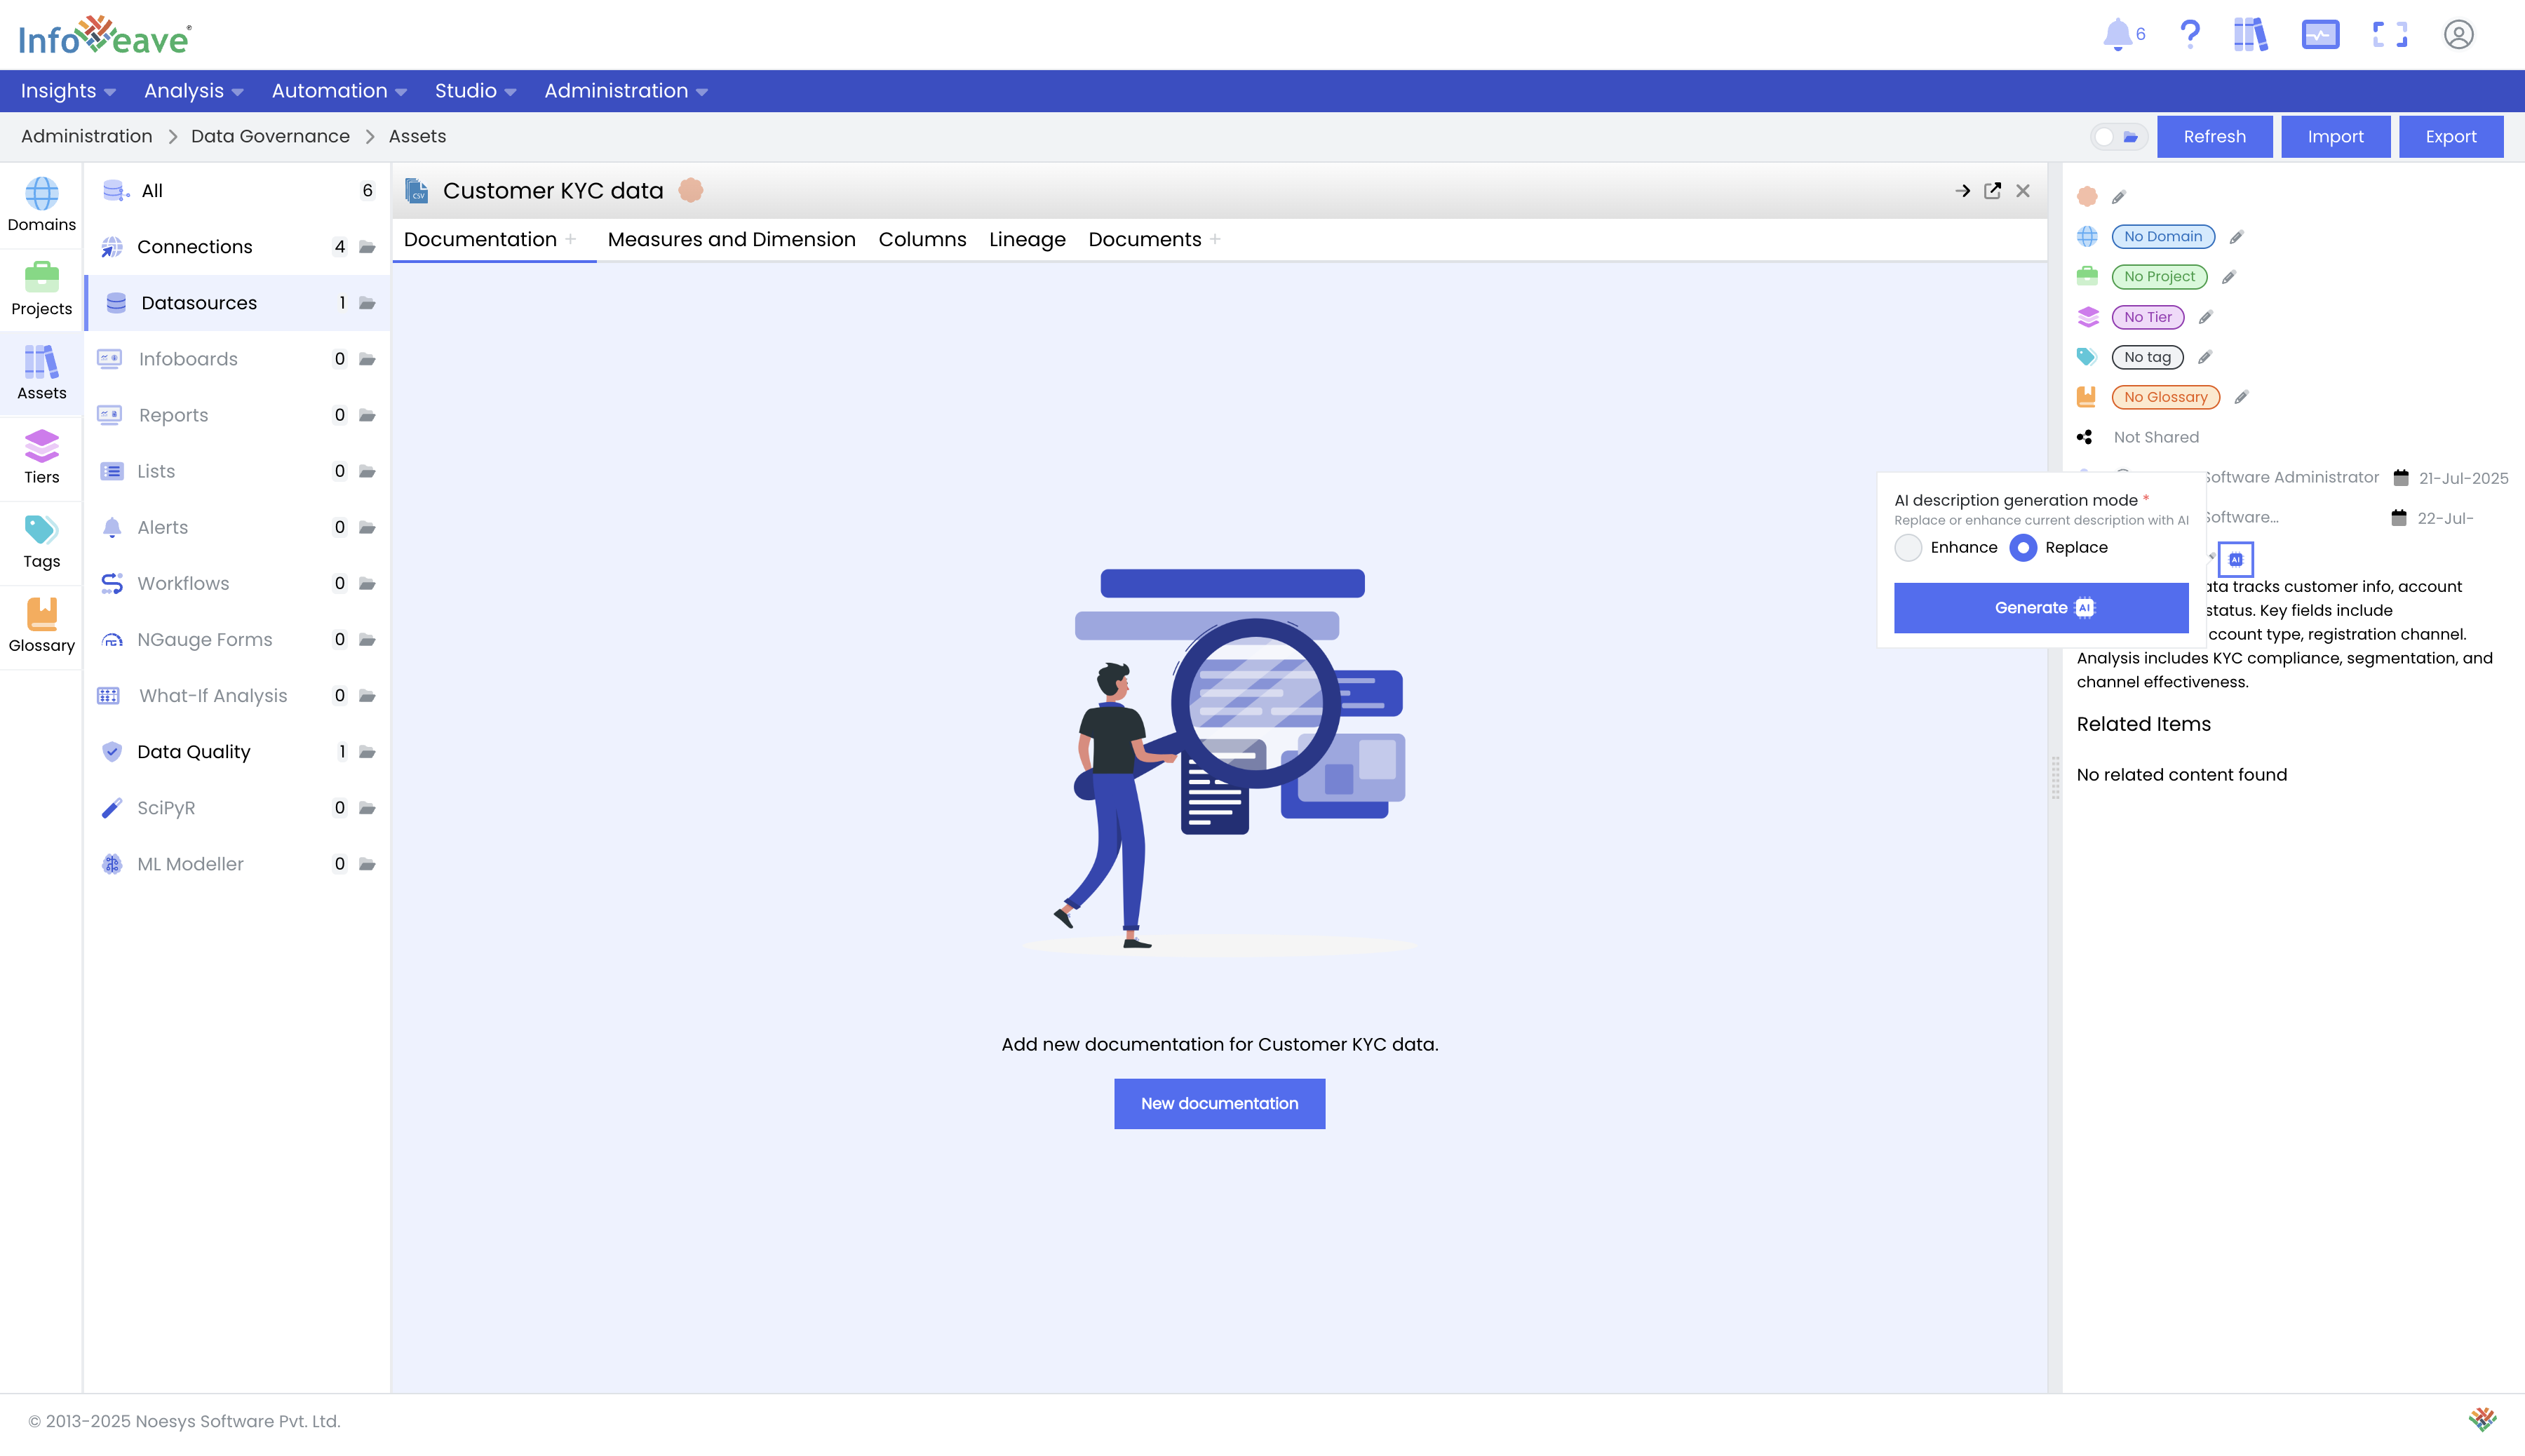
Generate AI-Powered Descriptions: Navigate to Catalogs and select your data source. Click the button to generate a description using GenAI. You can configure what data can be sent to GenAI to build the catalog. By default Infoveave uses the metadata such as column name, data types, any relationships (in the data model) to generate the catalog.
-
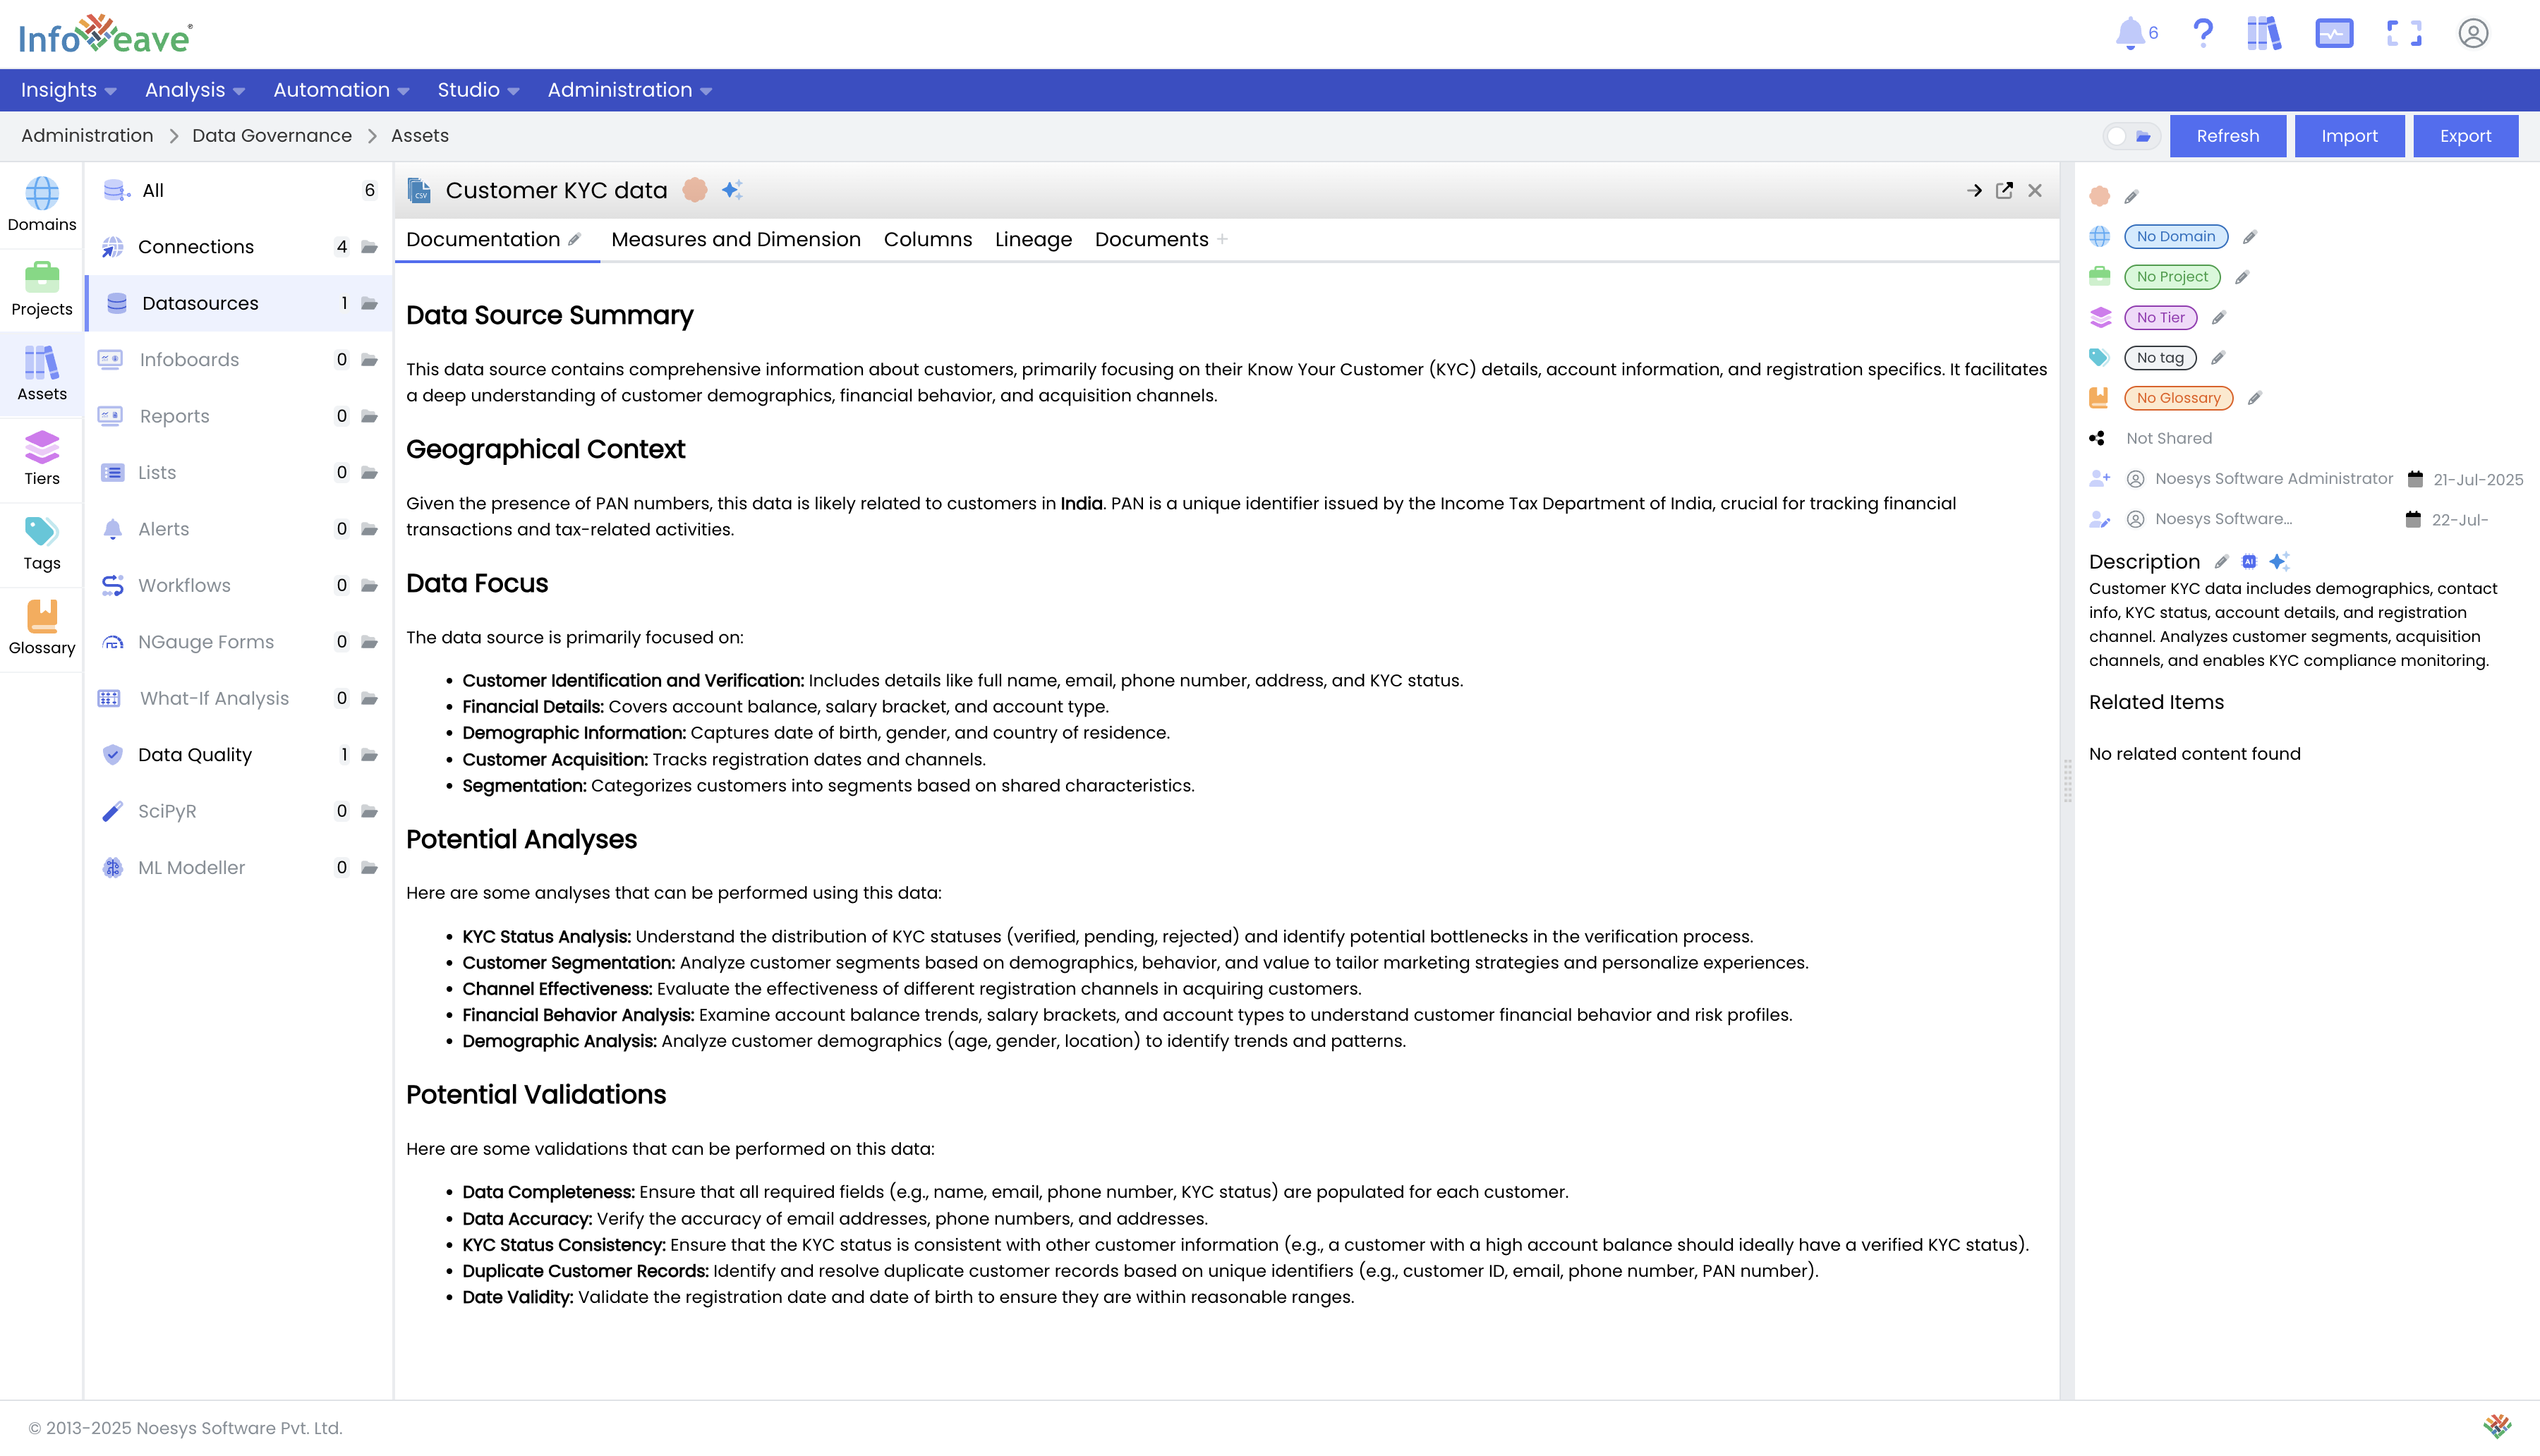
Review and Enhance Documentation: Infoveave's GenAI tools will generate a relevant description for the dataset, including column information, potential validations, and other insights. You can enhance this documentation by providing more context under the "Documents" tab.
Configuring Data Quality Rules
-
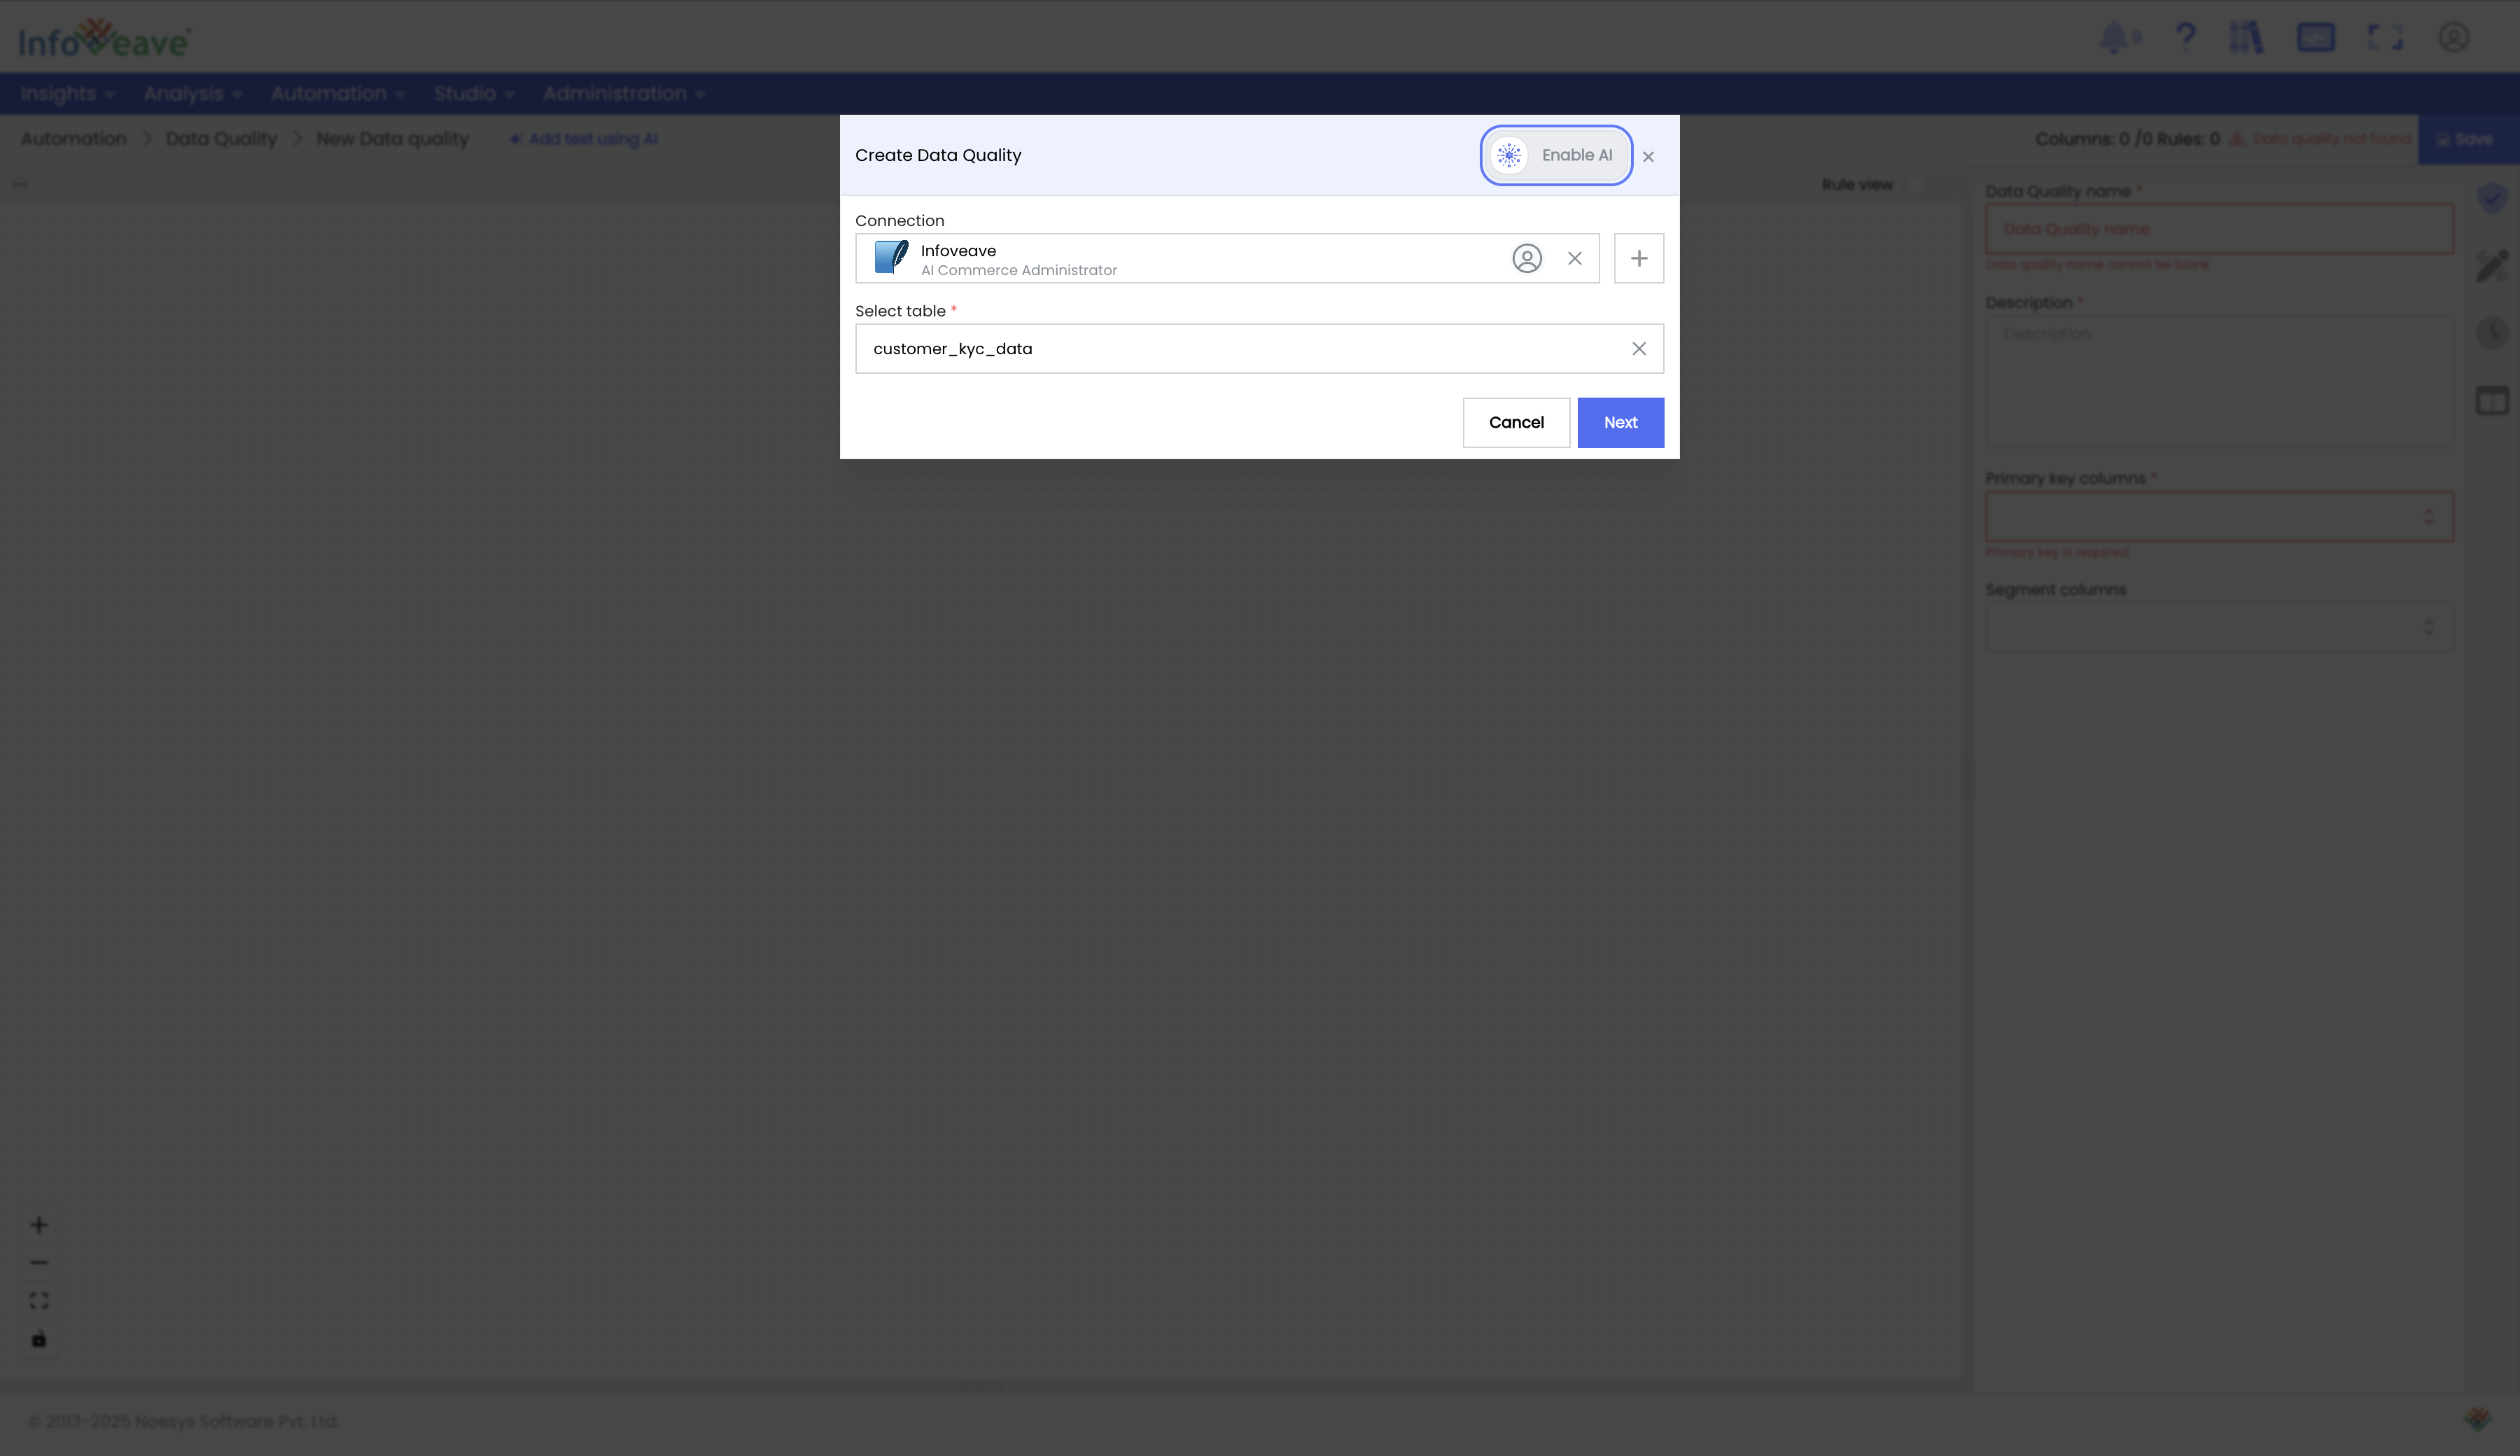
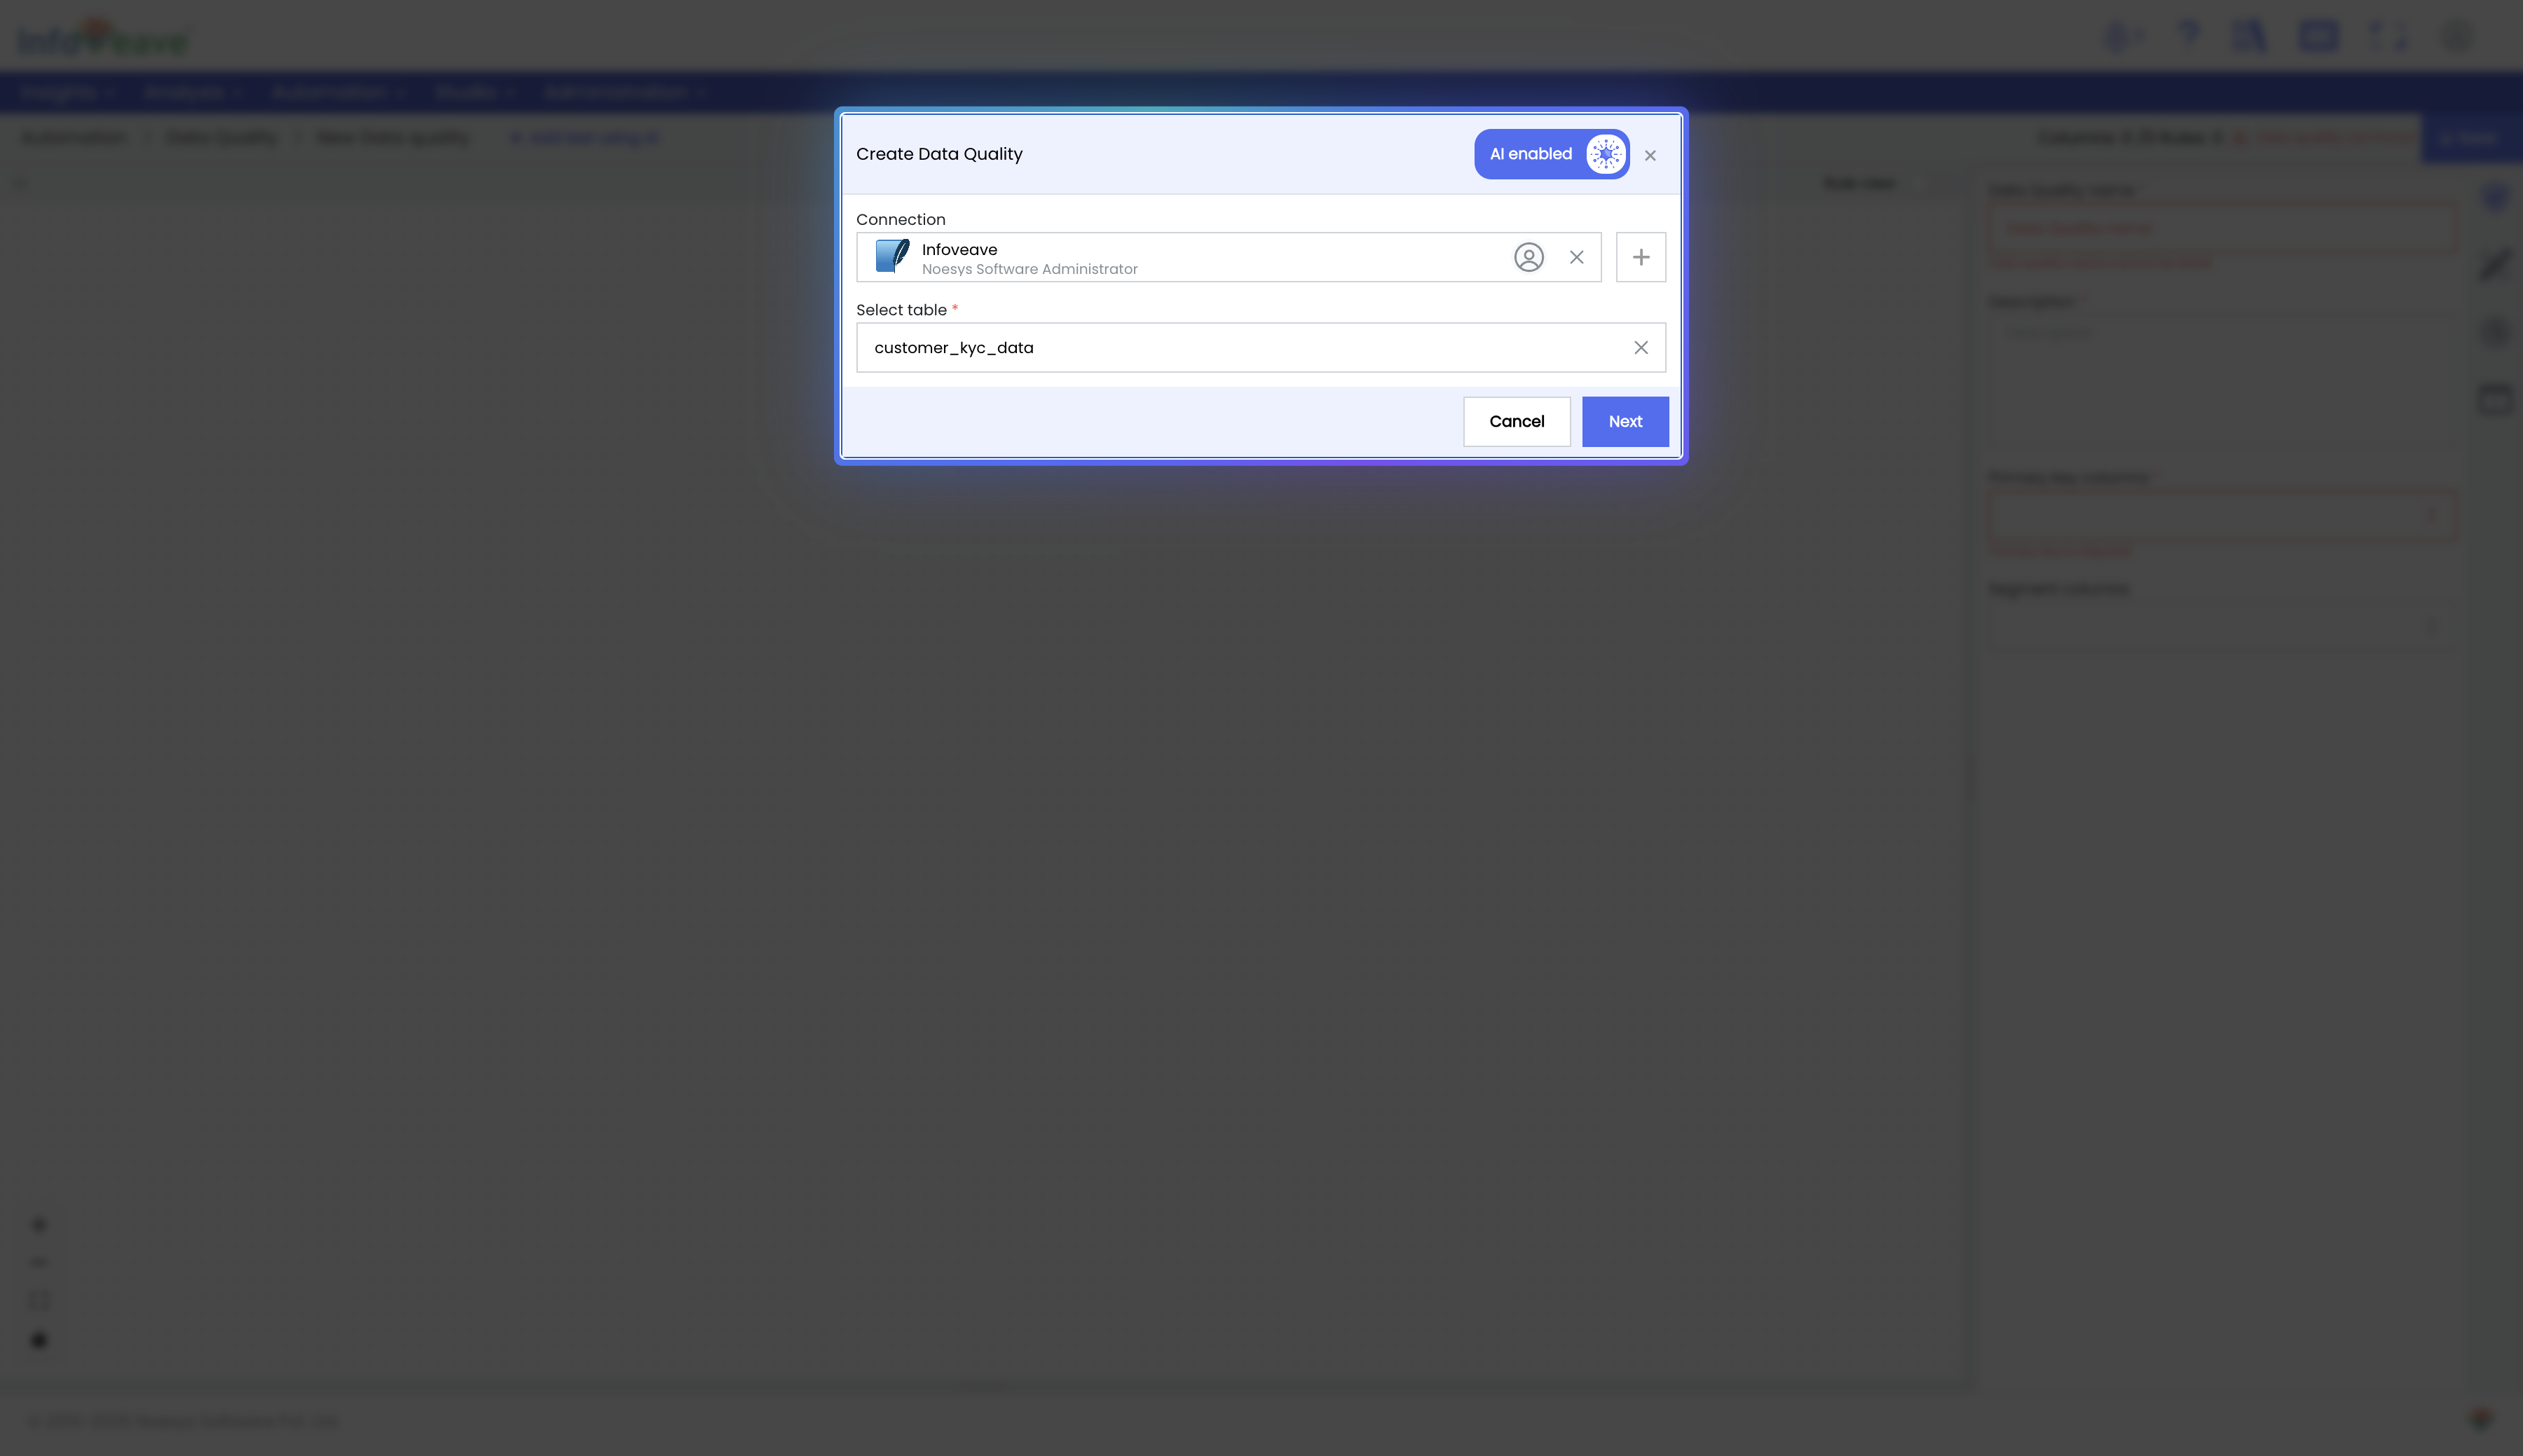
Create a New Data Quality Task: Select a data source to set up data quality rules. Infoveave's data quality engine runs within your environment, ensuring no data leaves your network.
-
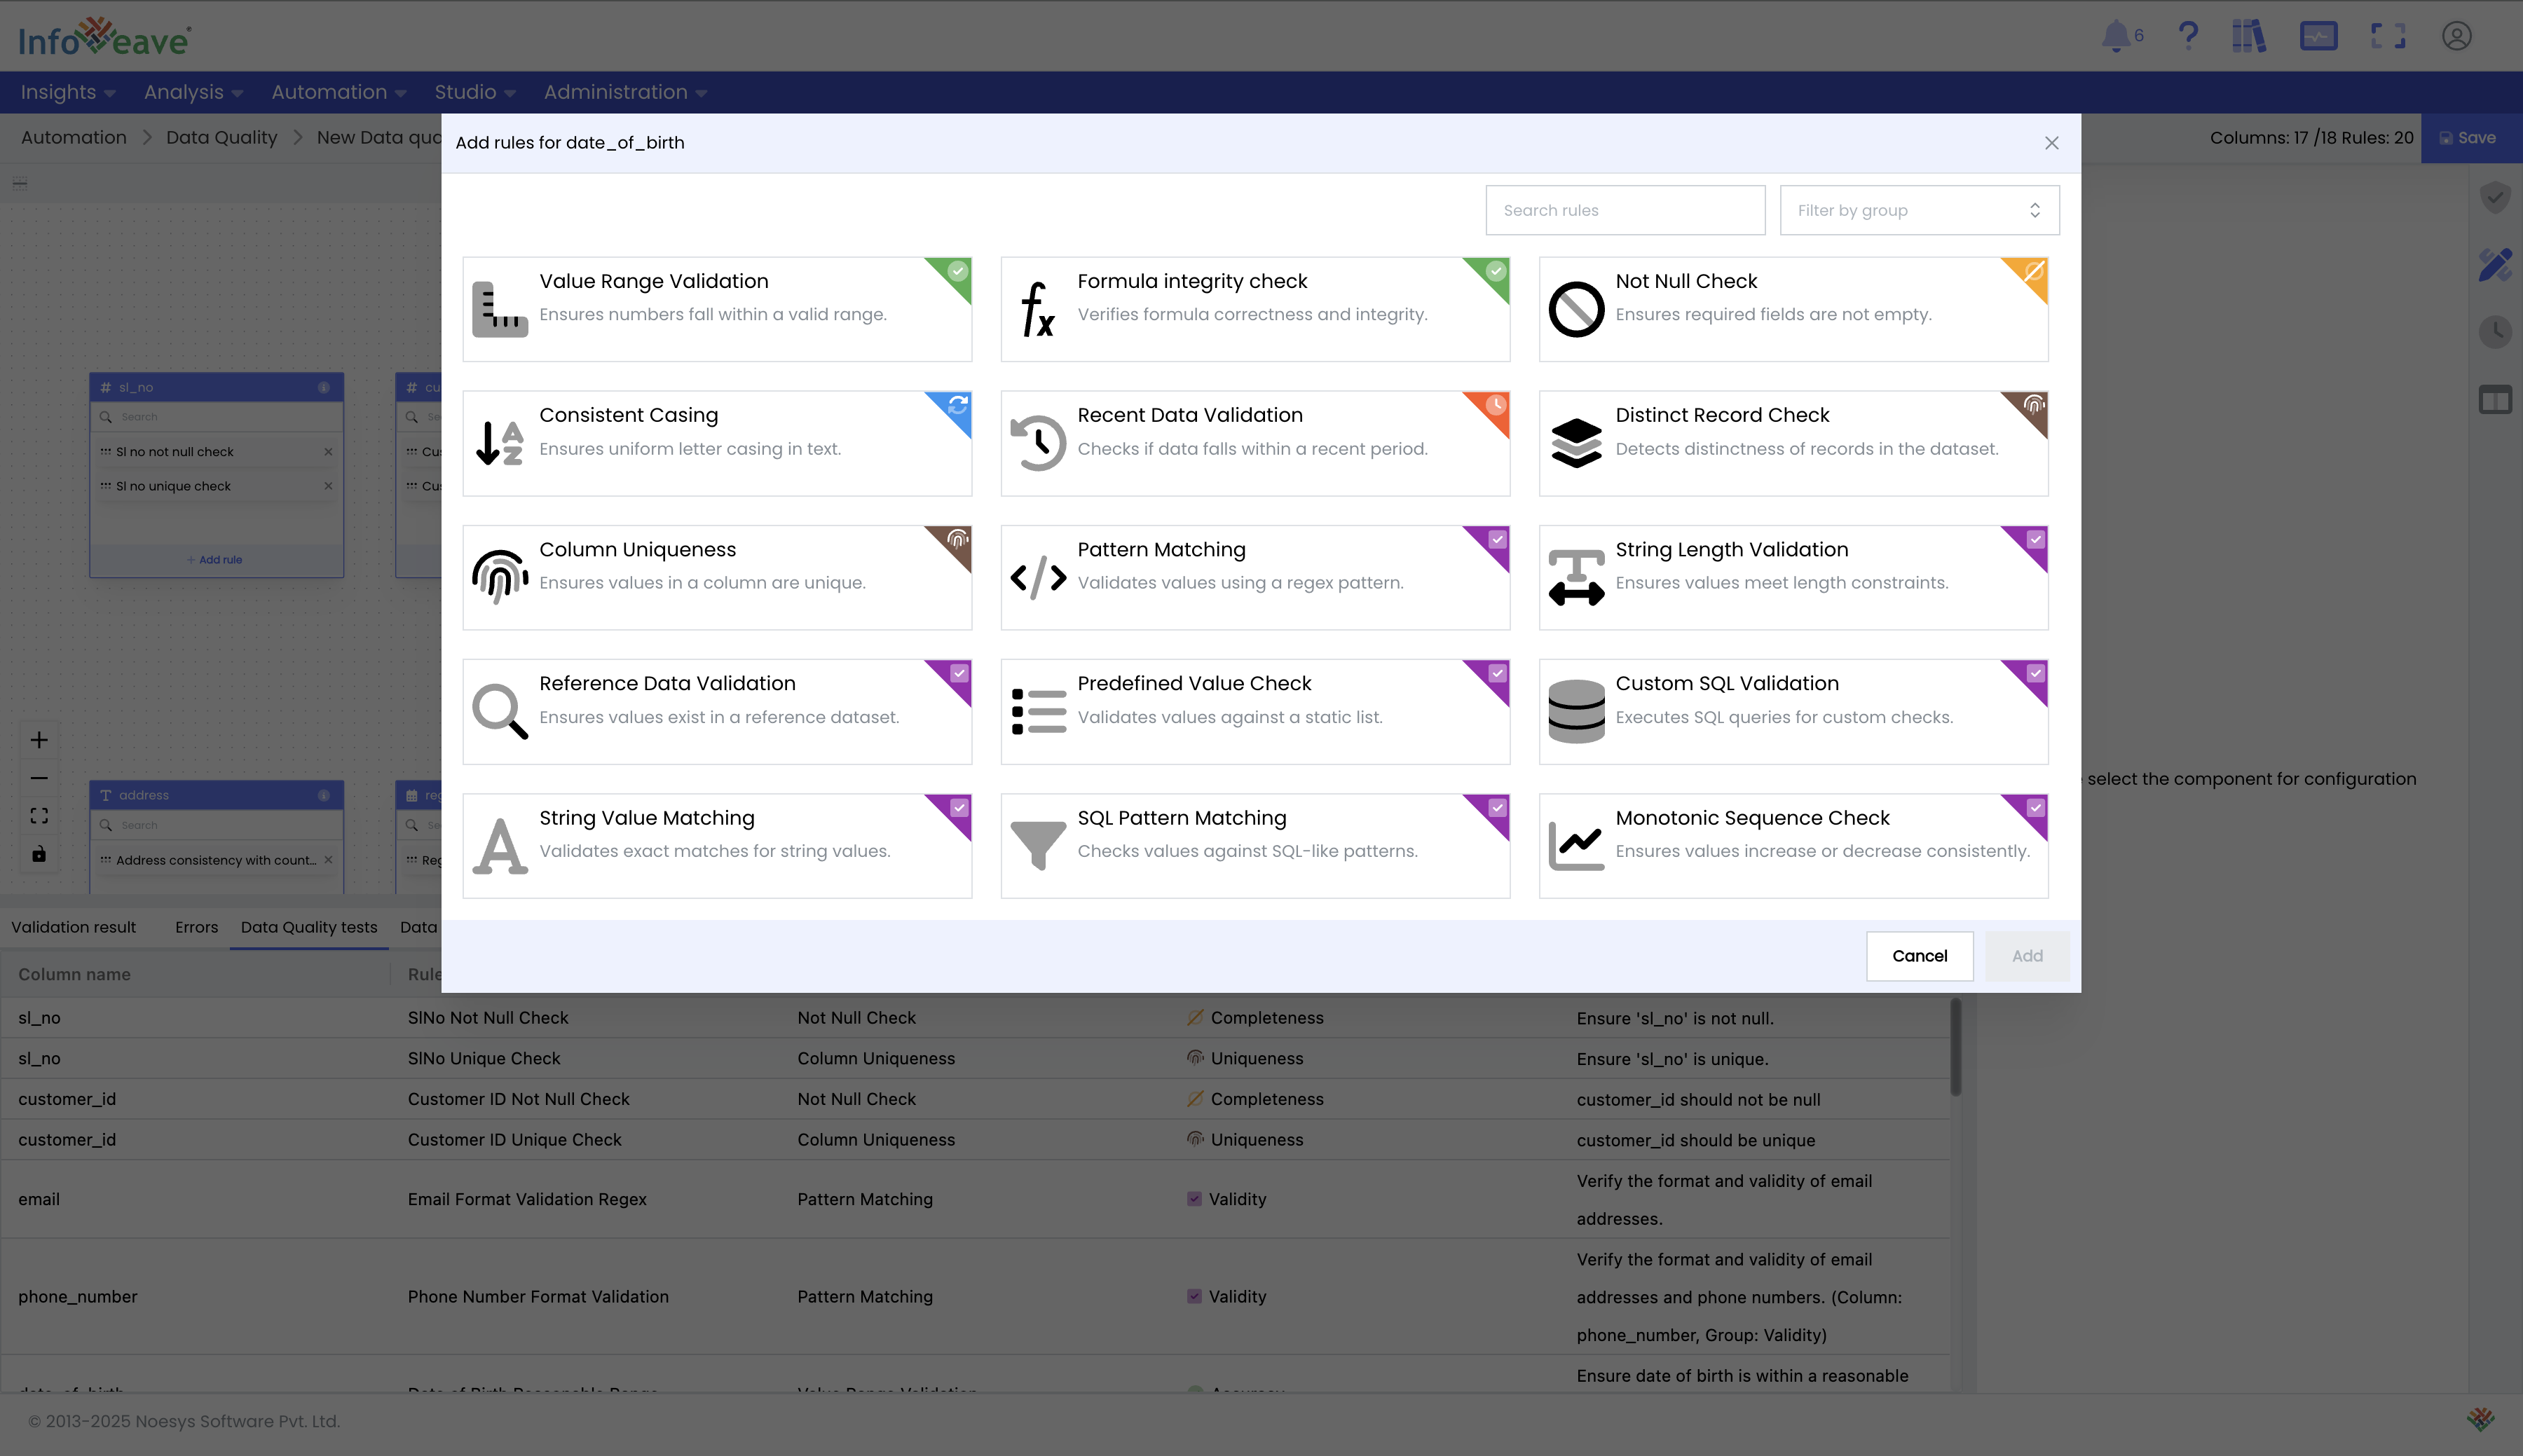
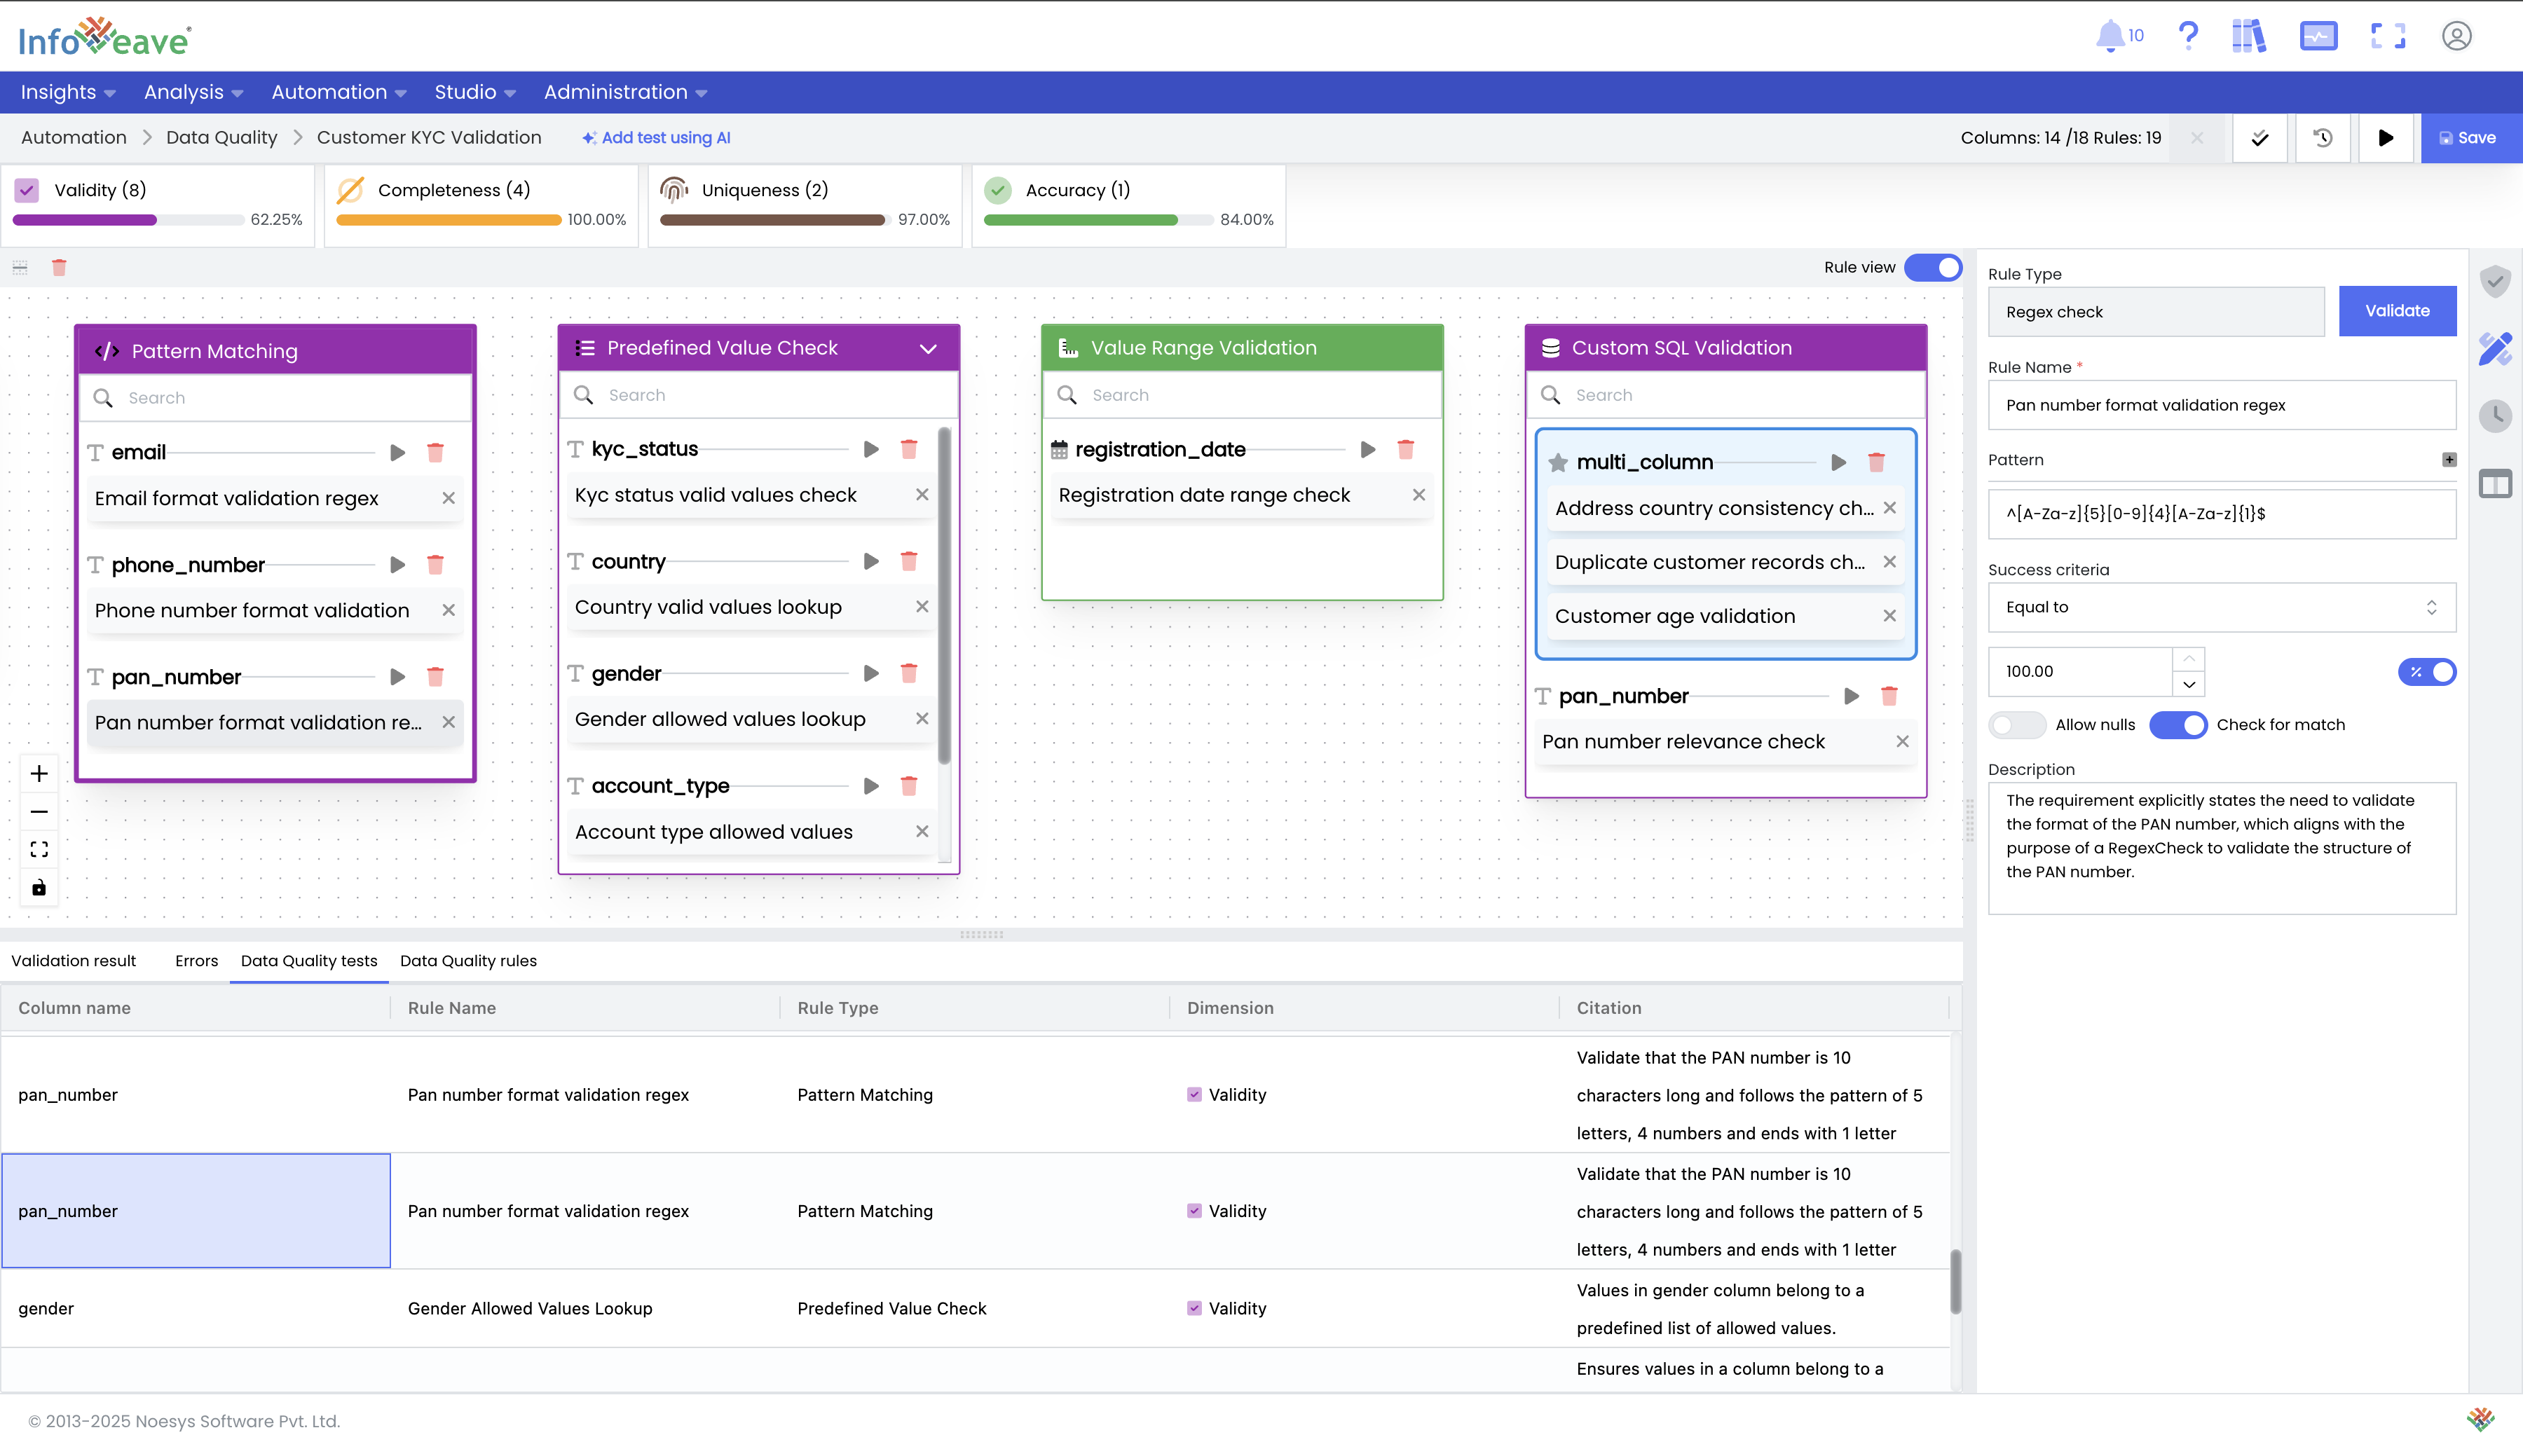
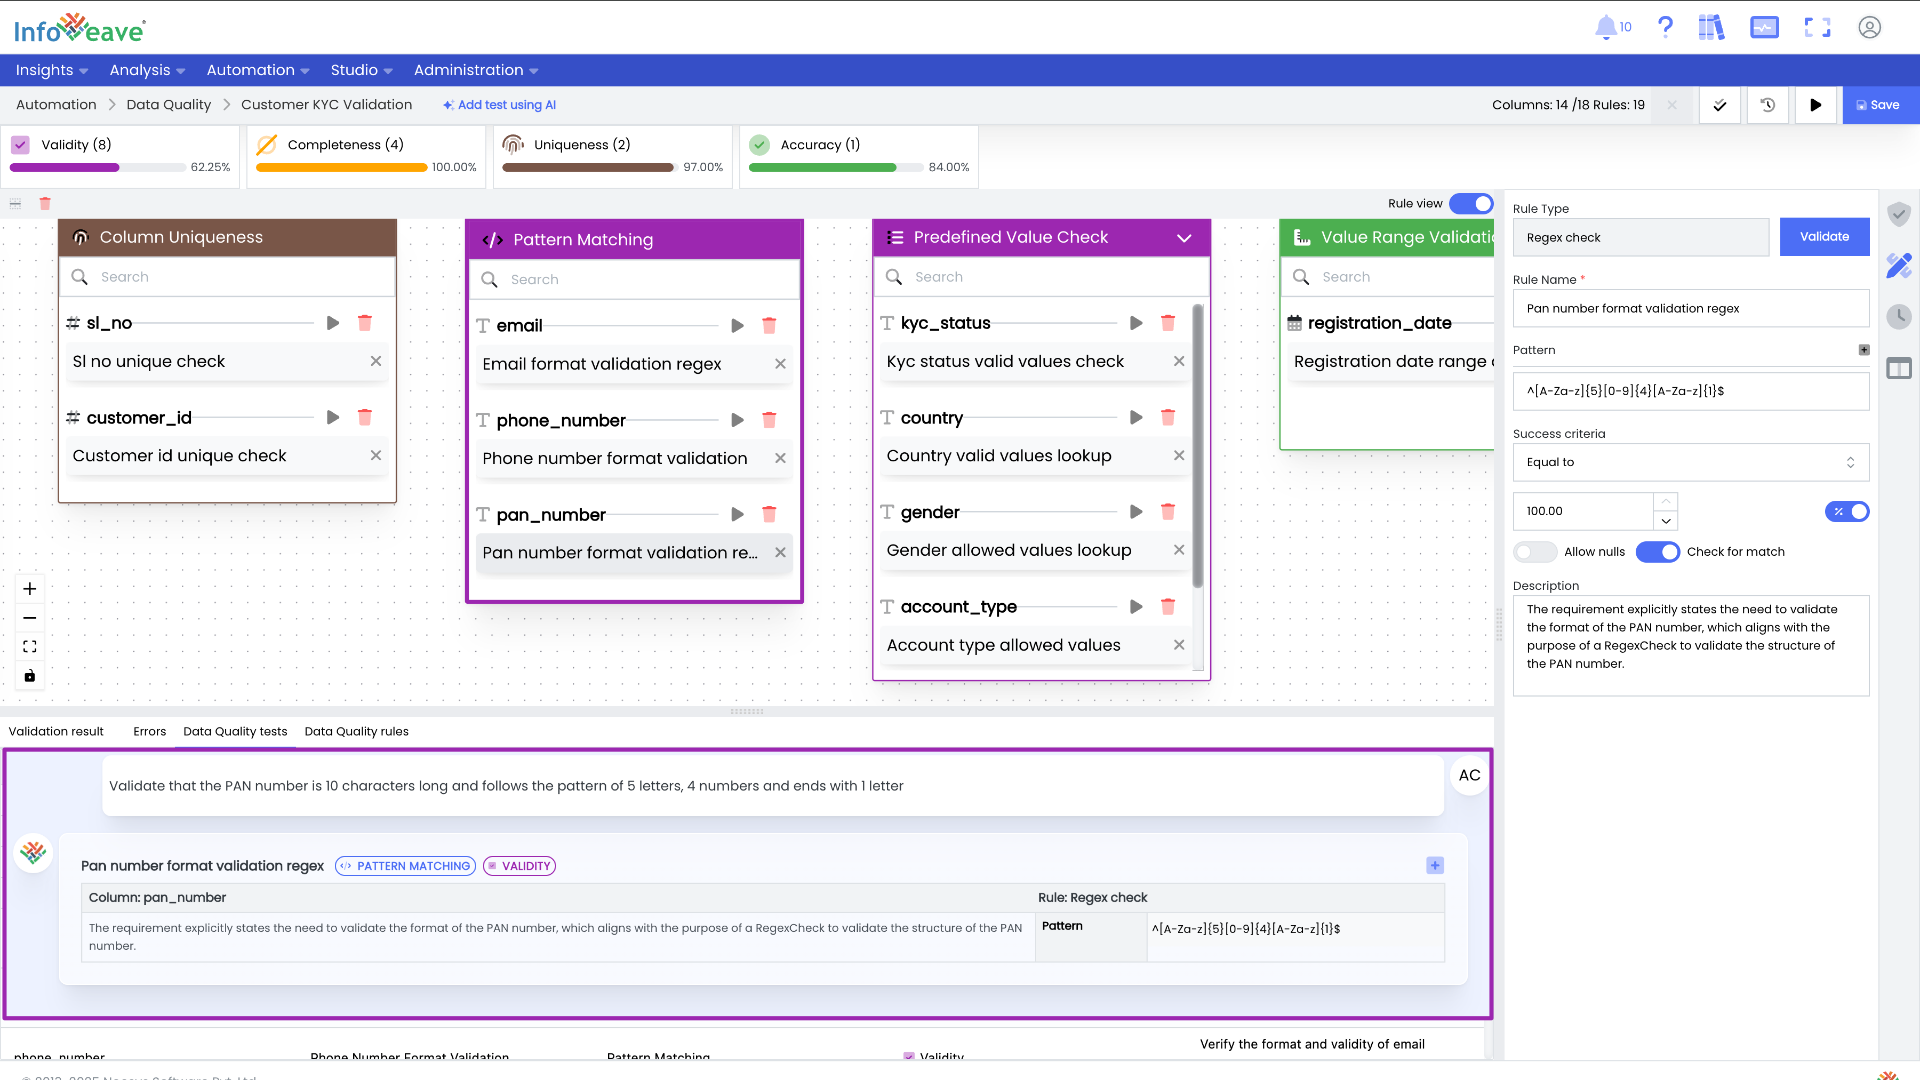
Define Rules with the Drag-and-Drop Interface: Configure data quality rules and tests using an intuitive, easy-to-use interface. All tests are organized under their respective dimensions. For example, under the Accuracy dimension, you will find tests like Value Range Validation and Pattern Matching.
Data Quality Rules by Dimension
Dimension Rule Name Description Completeness Not Null Check Ensures required fields are not empty. Uniqueness Distinct Record Check Detects distinctness of records in the dataset. Column Uniqueness Ensures values in a column are unique. Accuracy Value Range Validation Ensures numbers fall within a valid range. Formula Integrity Check Verifies formula correctness and integrity. Validity Pattern Matching Validates values using a regex pattern. String Length Validation Ensures values meet length constraints. Reference Data Validation Ensures values exist in a reference dataset. Predefined Value Check Validates values against a static list. Custom SQL Validation Executes SQL queries for custom checks. String Value Matching Validates exact matches for string values. SQL Pattern Matching Checks values against SQL-like patterns. Monotonic Sequence Check Ensures values increase or decrease consistently. Timeliness Recent Data Validation Checks if data falls within a recent period. Consistency Consistent Casing Ensures uniform letter casing in text.
-
Set Thresholds and Execute: Set pass/fail thresholds as numeric values or percentages for custom alerting. Save and execute the Data Quality task to generate a comprehensive report on your data's health.
Day 3: Leveraging GenAI for Data Quality
GenAI can be a powerful asset for generating data quality rules and tests automatically. Infoveave can be configured to run with any supported LLM. Unless explicitly specified, Infoveave never sends any user data to the LLM. The tooling is designed to work only with metadata, documents, and other contextual information sourced from the Infoveave data catalog or other integrated organizational repositories.
-
Enable GenAI for Rule Creation: When creating a new data quality task, select your data source and enable the GenAI switch.
-
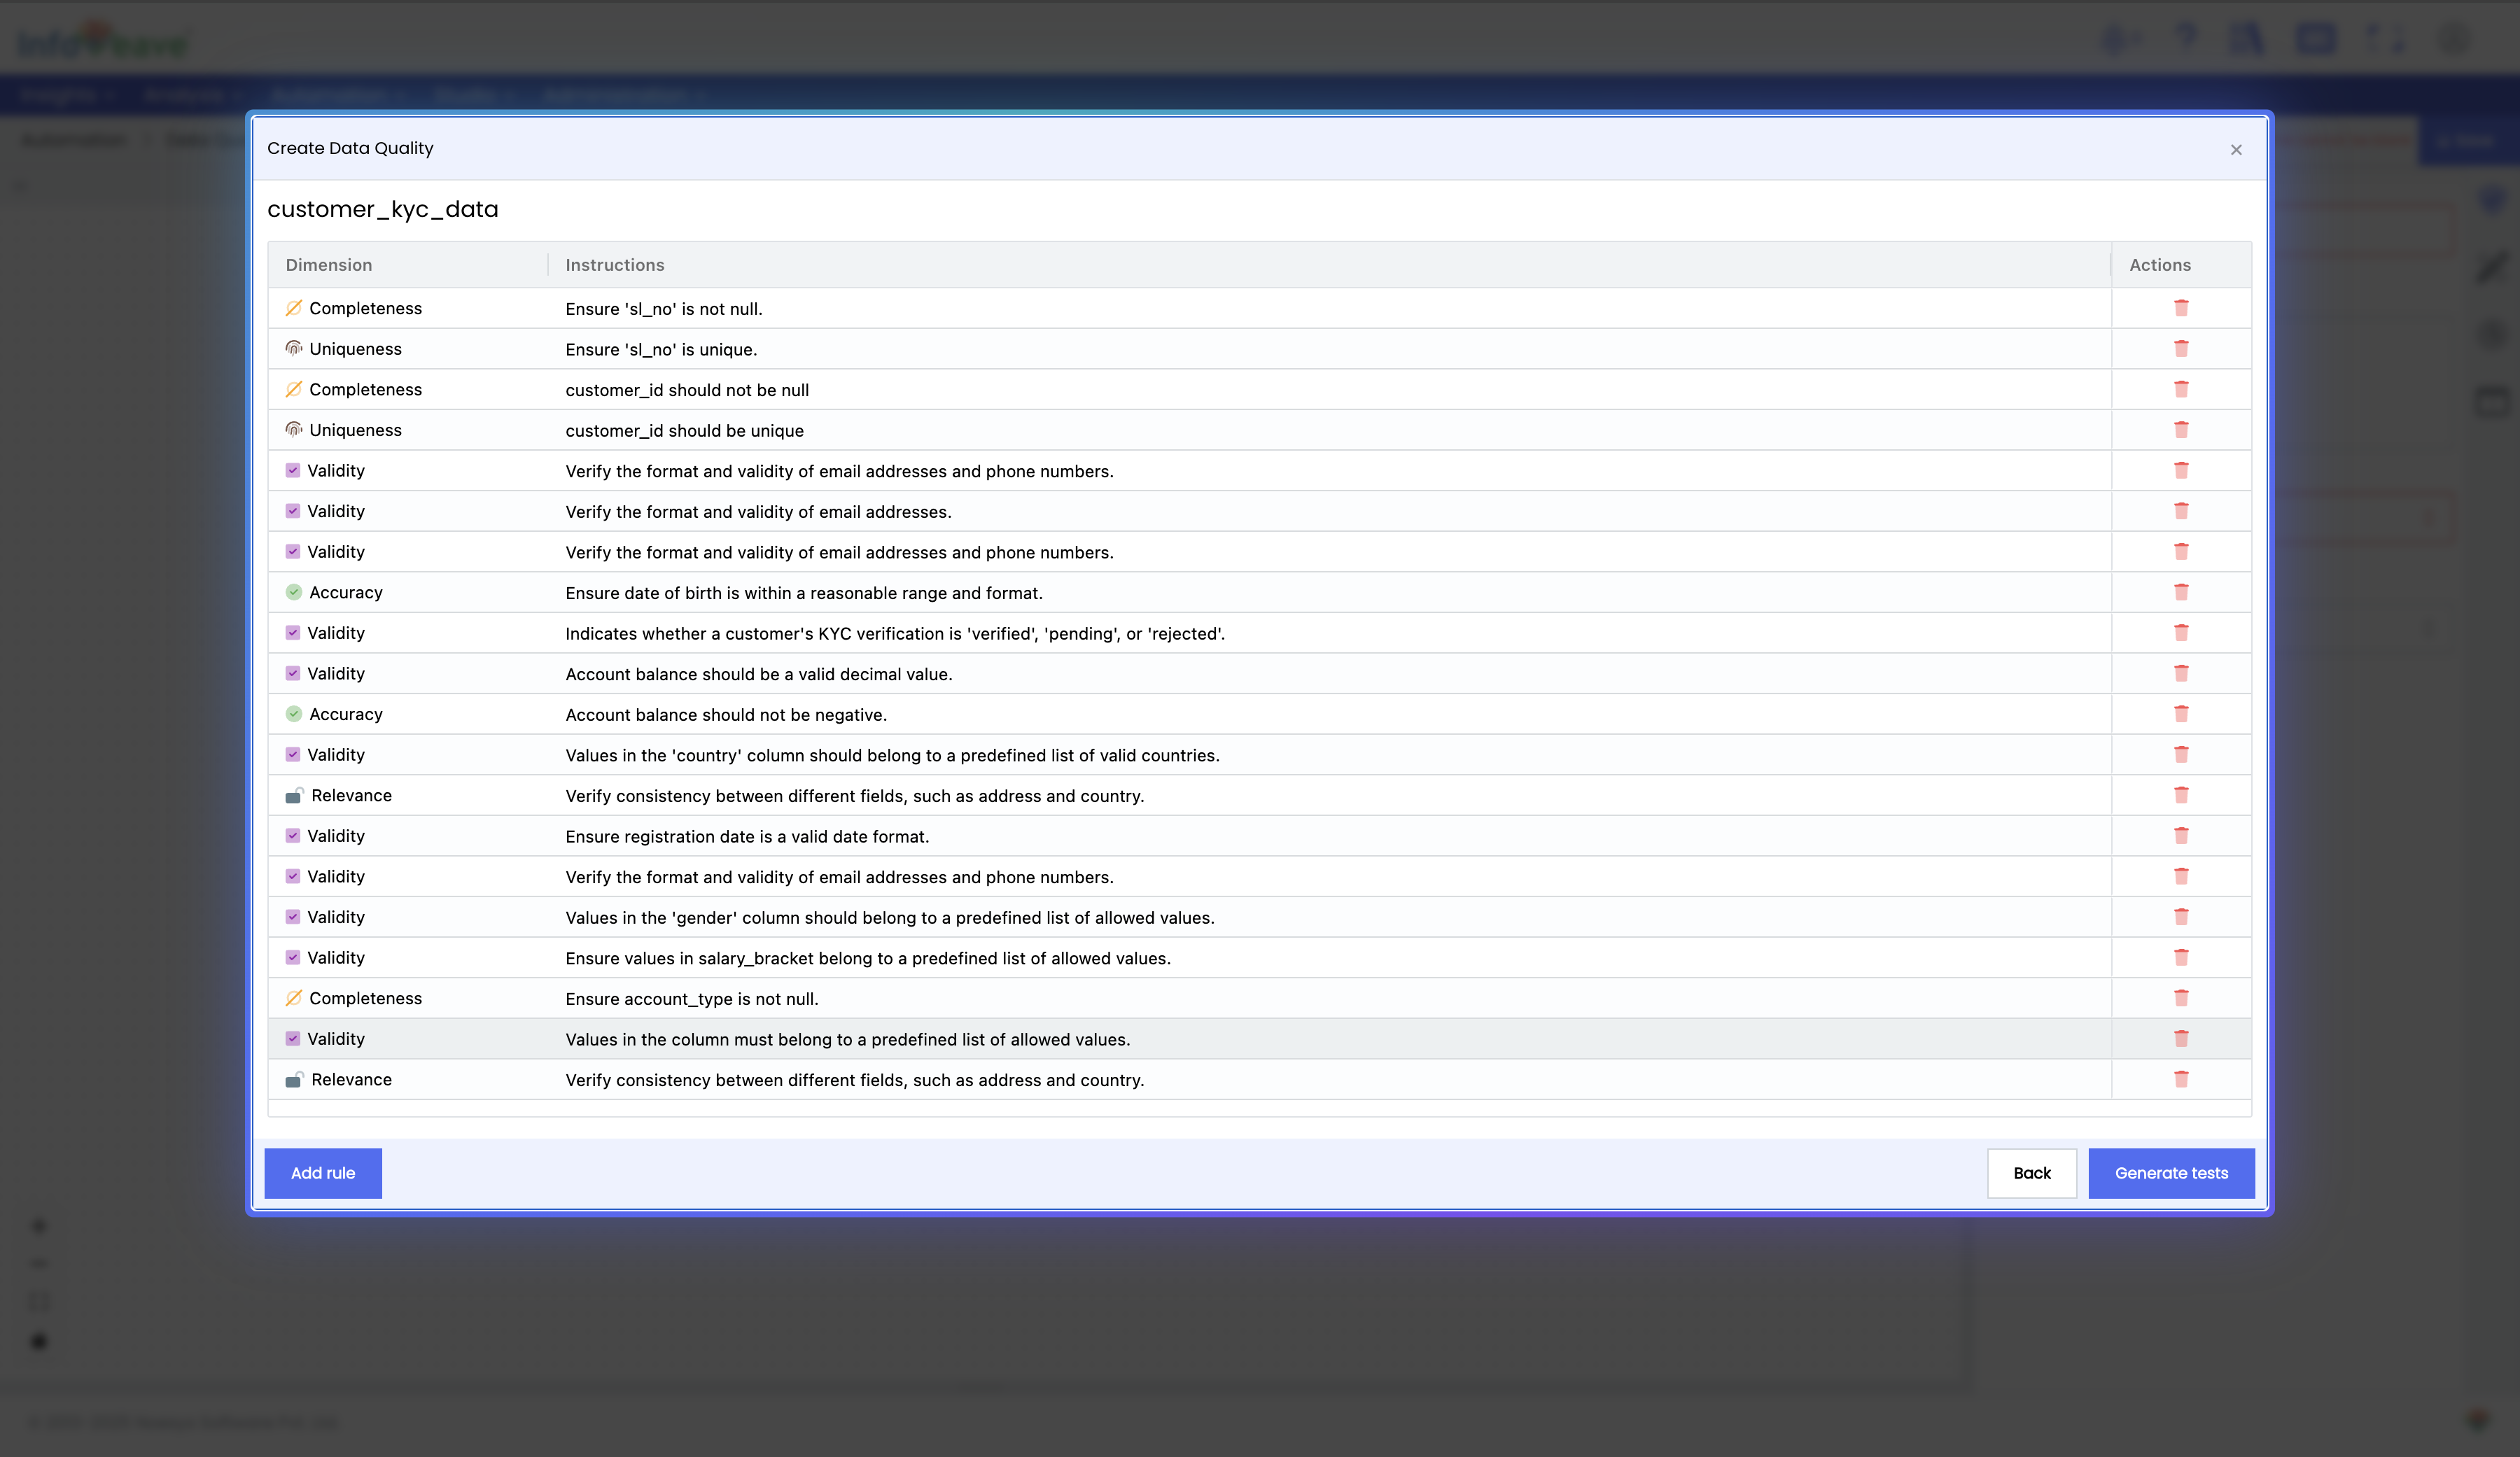
Auto-Generate Tests: Infoveave automatically generates relevant Data Quality tests based on the descriptive content in the catalog, associated documents (PDFs, Word, PowerPoint), and column metadata.
-
Refine and Add Rules: You can enhance the generated rules by adding more tests manually or by typing new rule descriptions in natural language. For example , "The age of the customer cannot be lesser than 18 years at time of registration", or "The total invoice should be unit price * quanity, less discount plus any taxes"
Day 4: Executing and Monitoring Data Quality
-
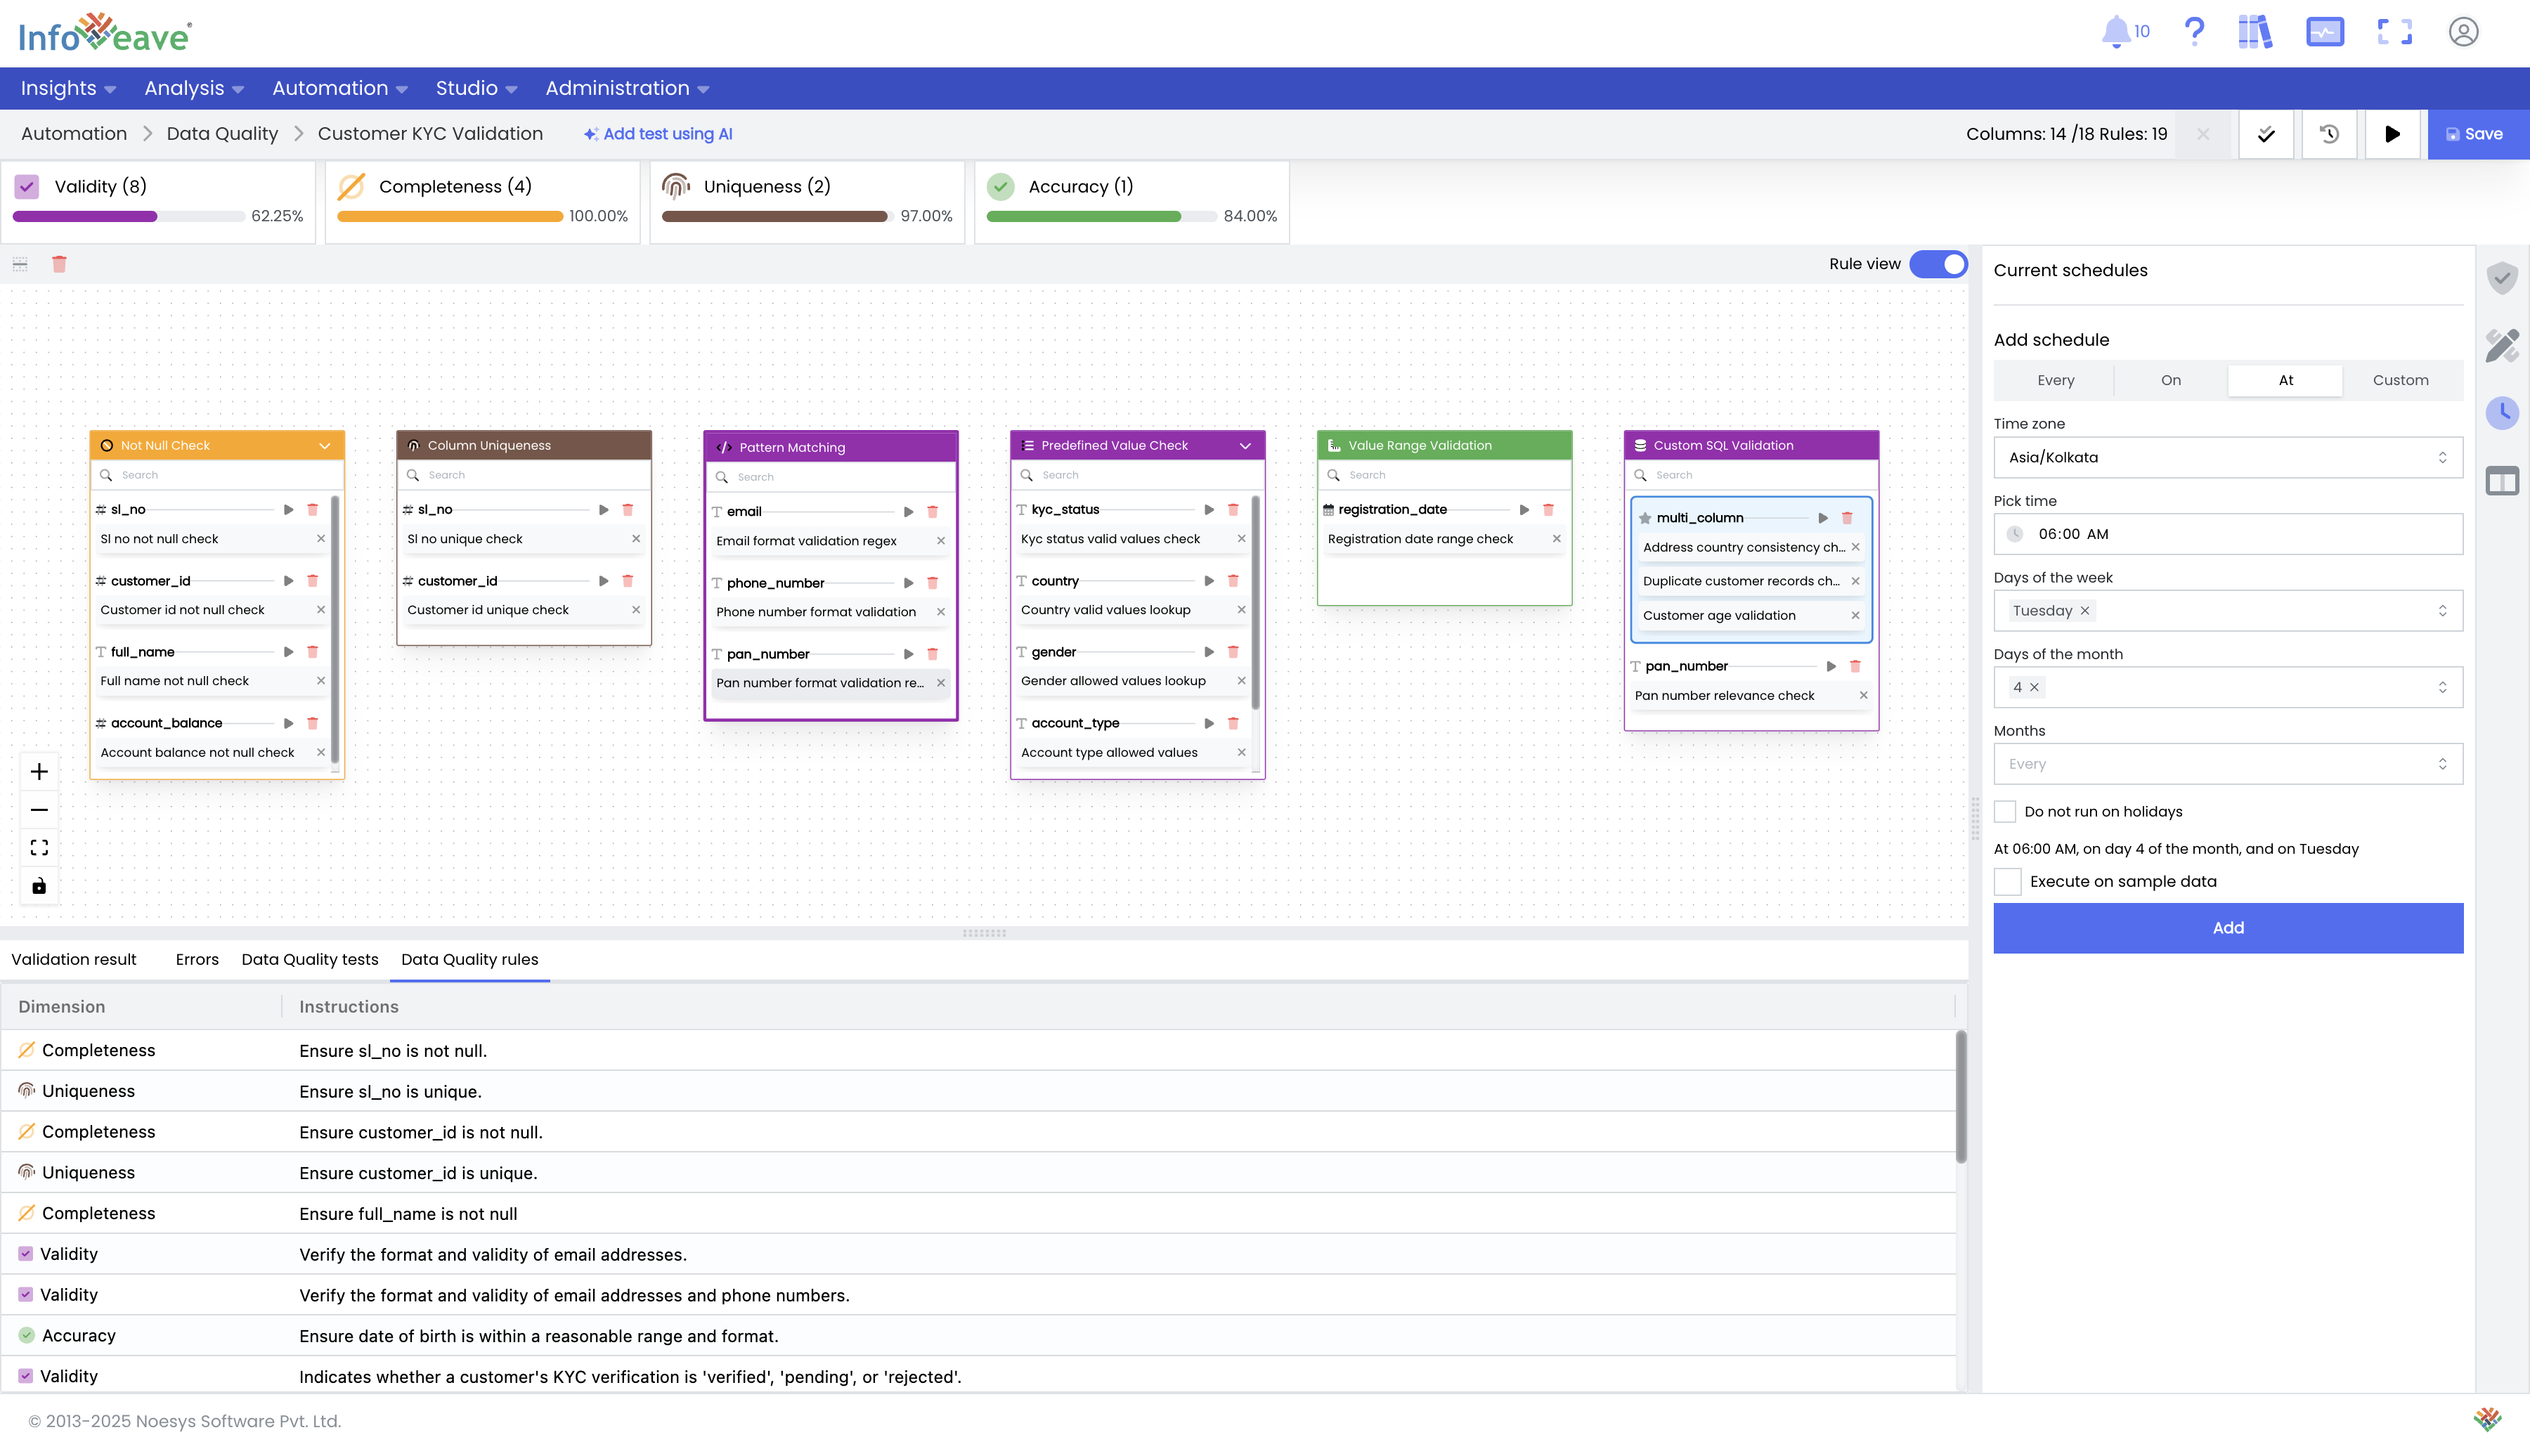
Schedule and Monitor DQ Runs: Schedule daily Data Quality runs to track changes in data health over time. You can configure a fixed frequency or invoke the Data Quality task on-demand via a webhook, which is covered in the next section.
-
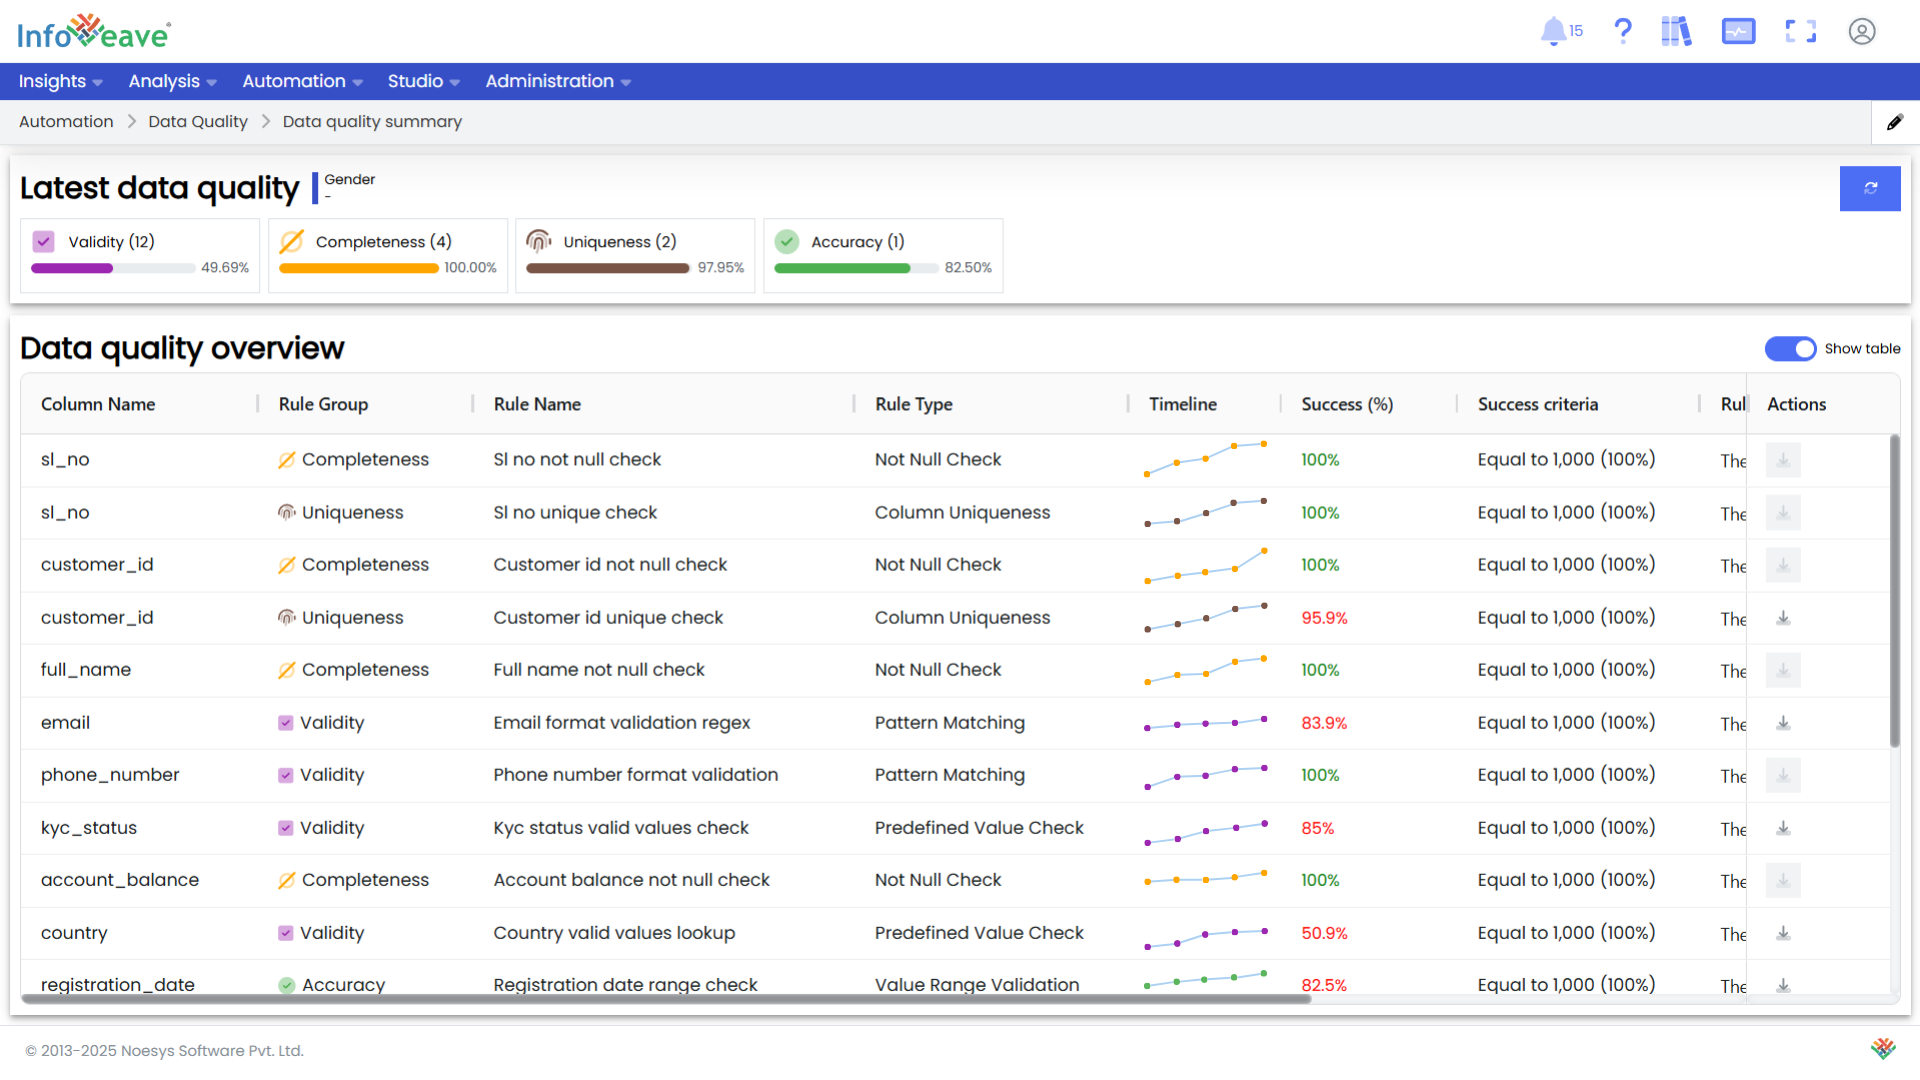
Review Health Dashboards: Infoveave provides pre-built dashboards to review and manage the overall health of your data. Data stewards can monitor compliance standards, adjust thresholds, define new rules, and create requirements for data pipeline changes to fix underlying issues.
-
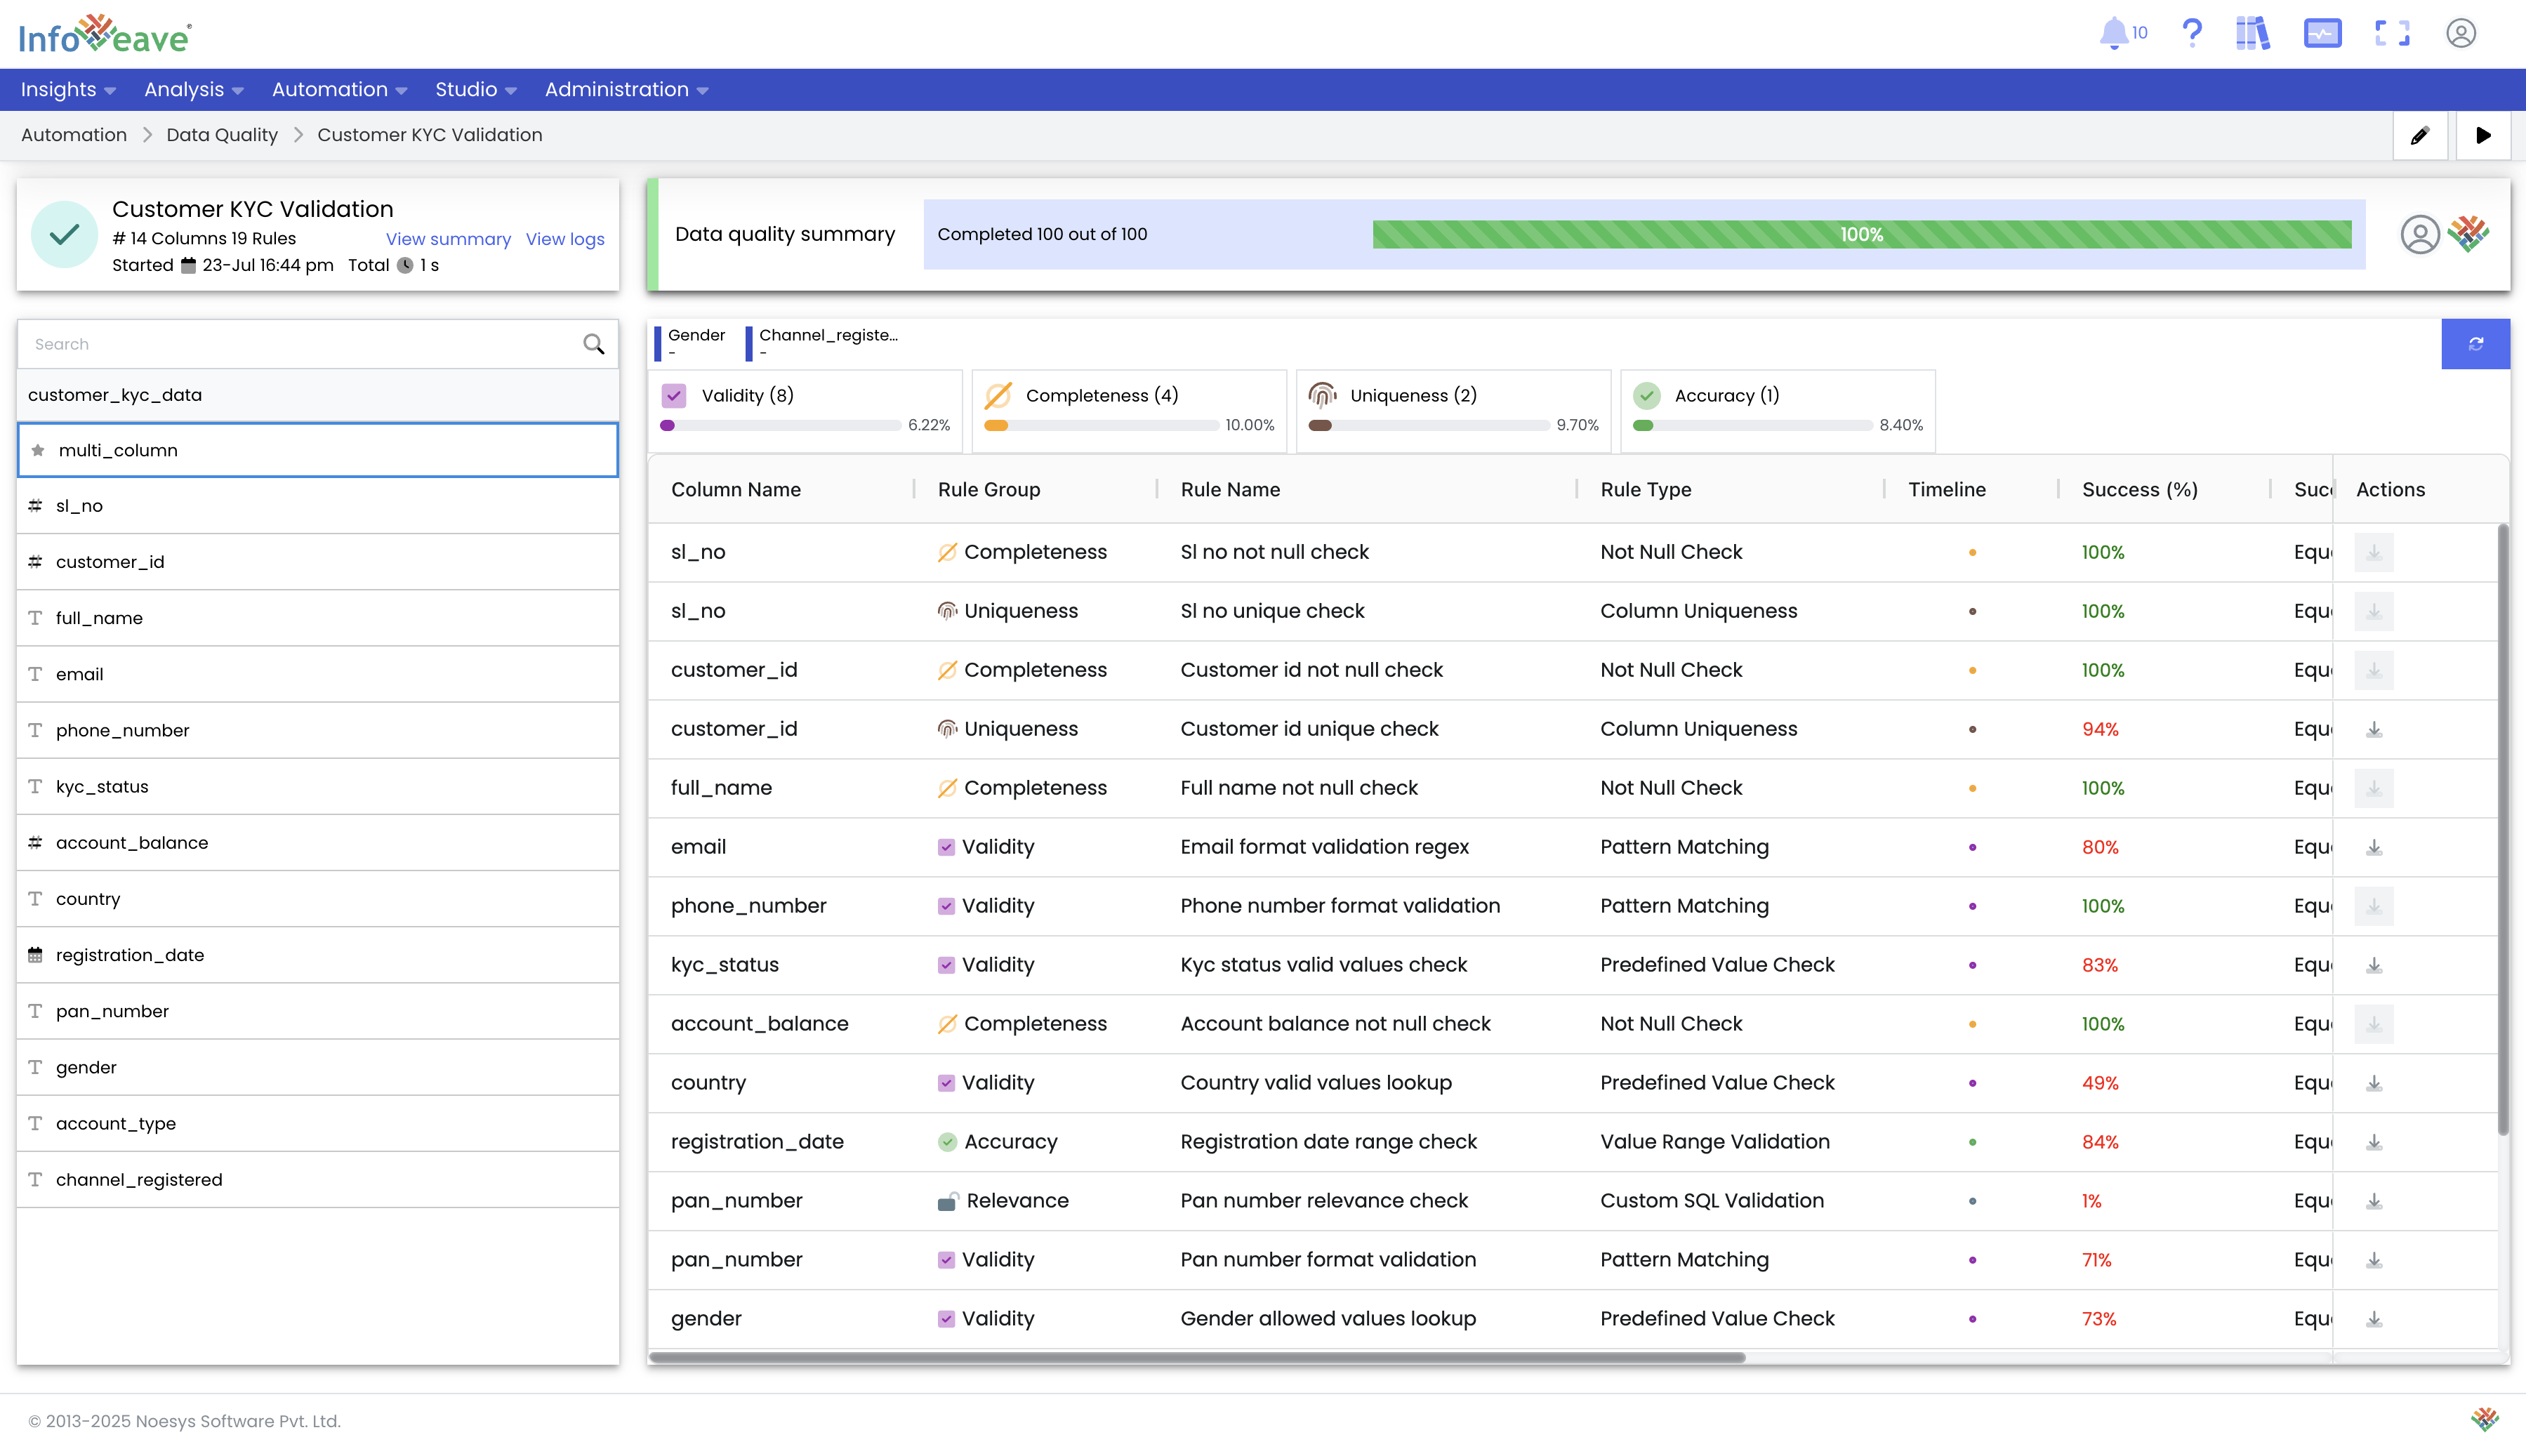
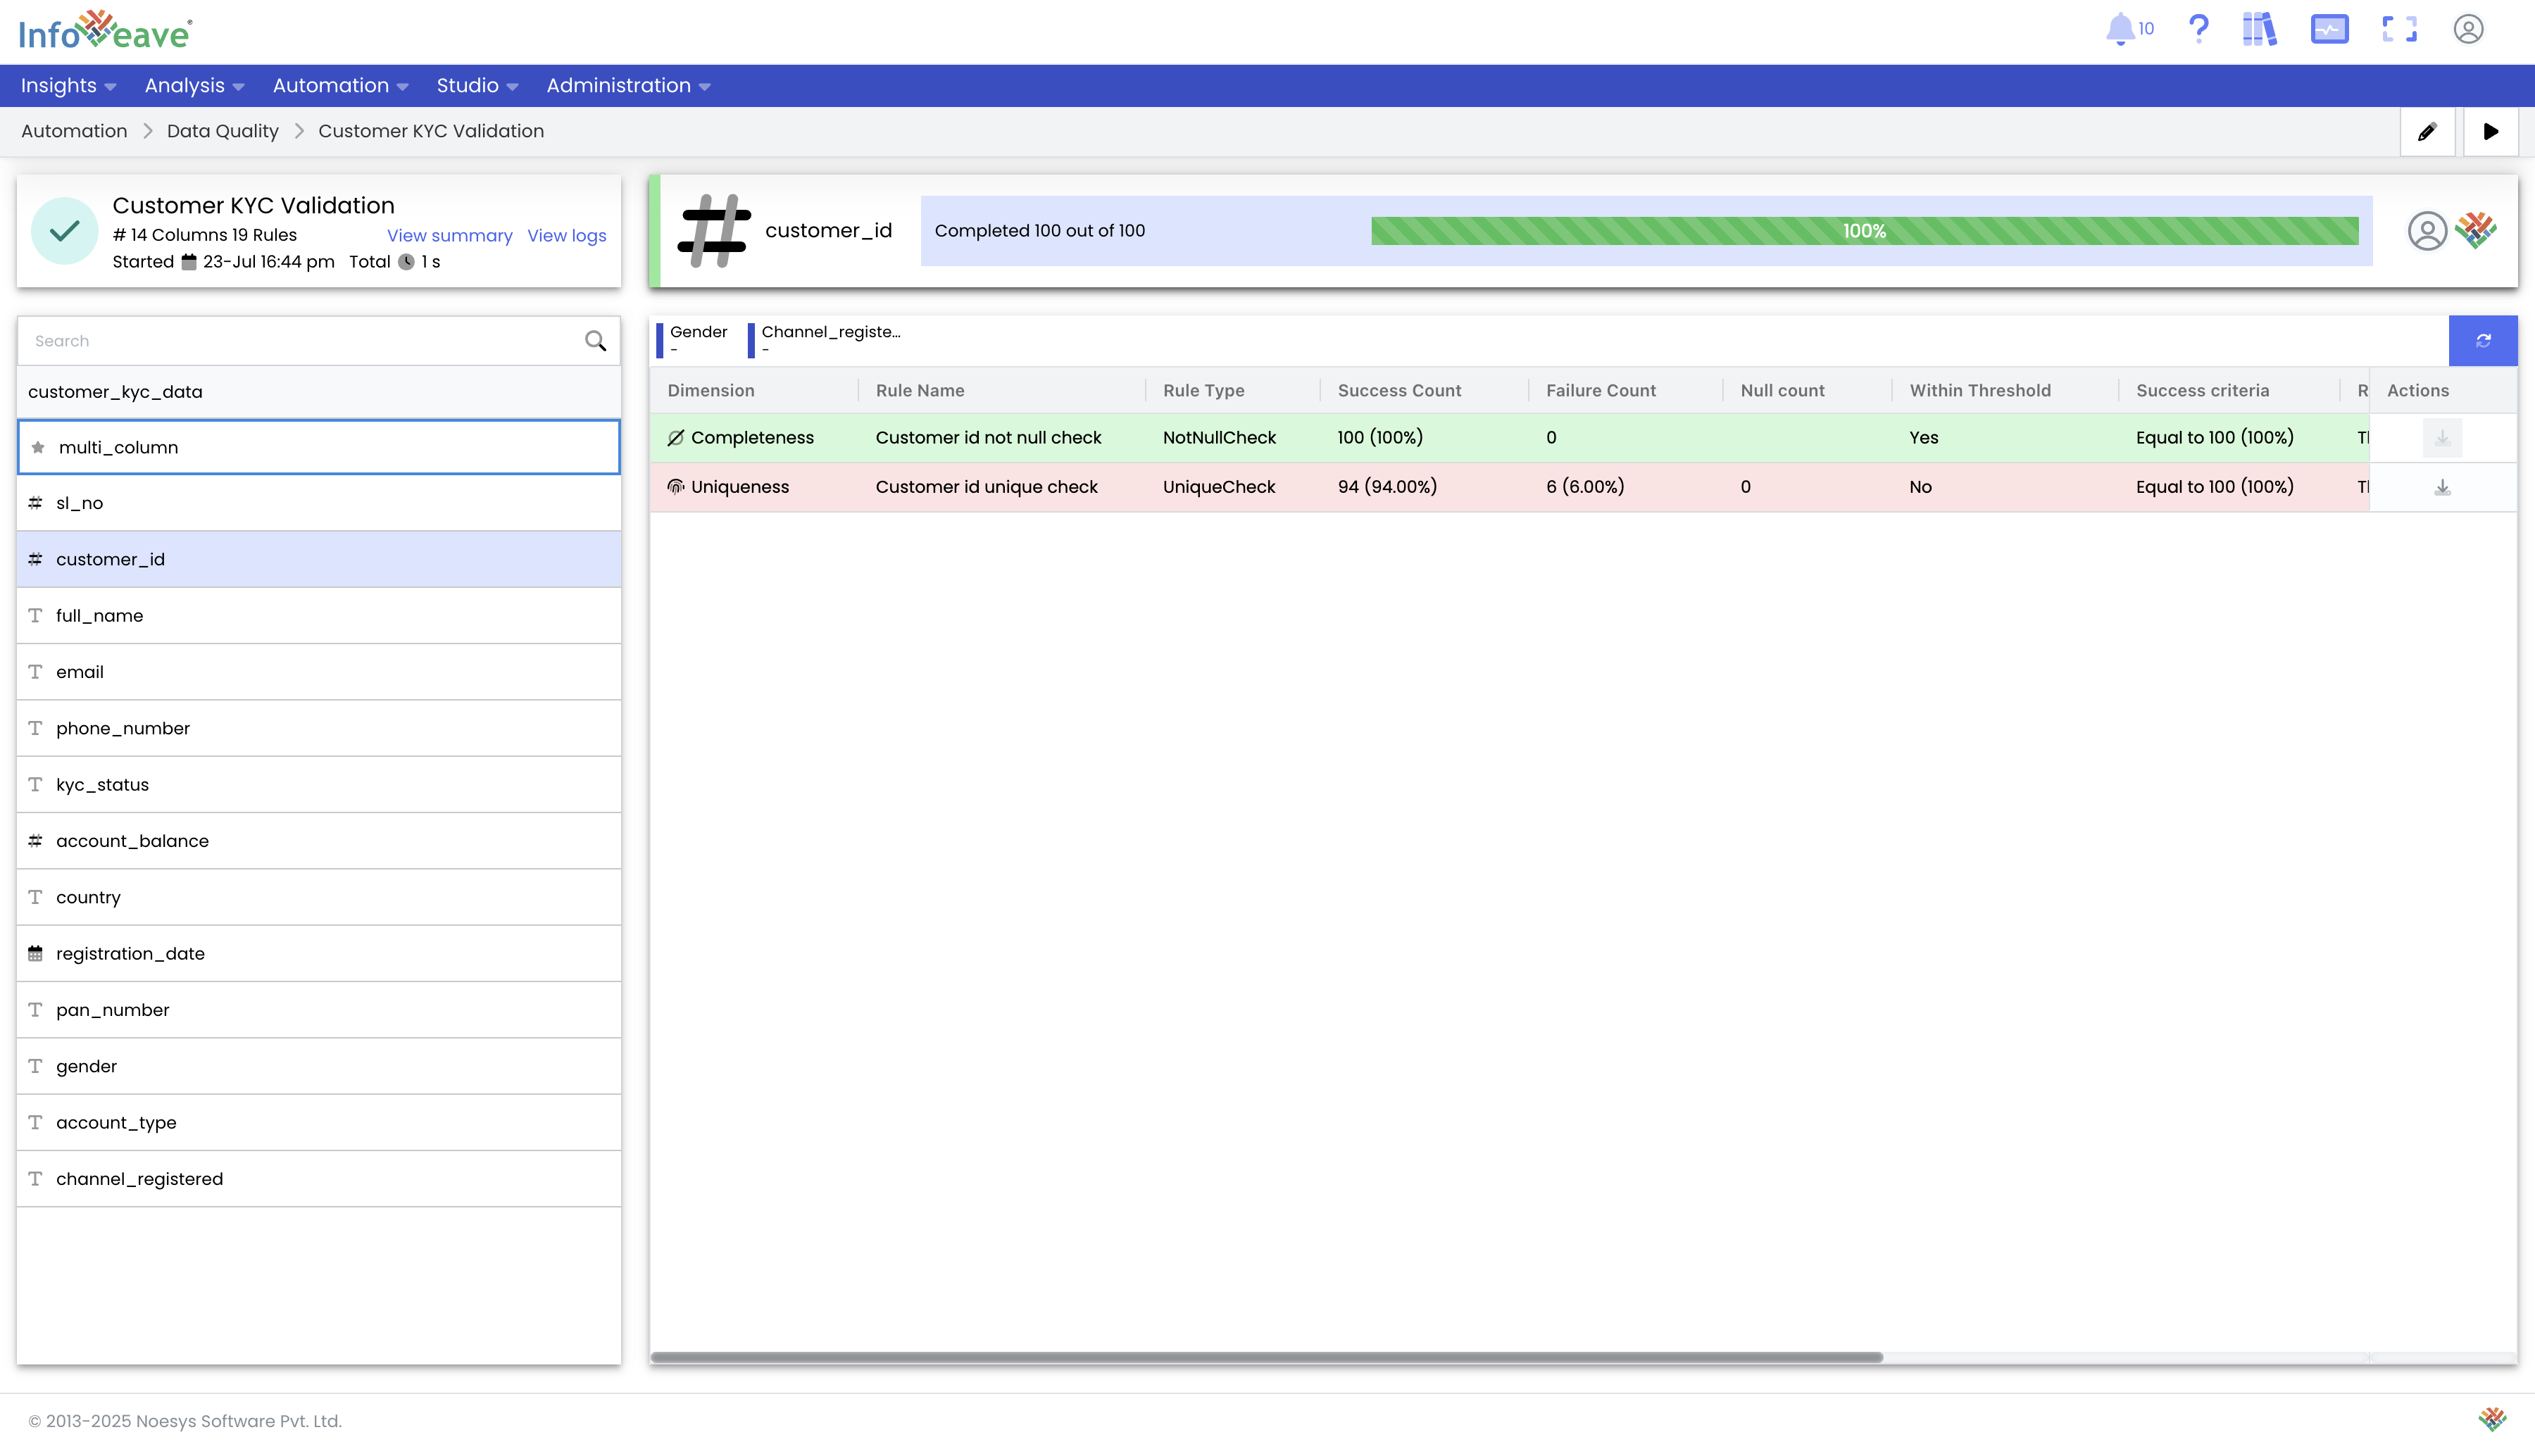
Analyze Detailed Logs: Each Data Quality instance execution provides a detailed view of logs and the results of each test. These logs can be downloaded for deeper analysis. The Data Quality results can be sent out as reports or back to integration partners to improve the quality of their APIs and feeds.
-
Segment Issues by Dimension: Infoveave allows for the segmentation of data quality issues by business dimensions. You can configure rules to aggregate errors by categories like state, product, or date (week, month). This allows you to manage remediation for each segment in separate pipelines to reduce server load or apply specific business logic.
Day 5: Integrating Data Quality into Enterprise Data Pipelines
Infoveave workflows seamlessly integrate with the Data Quality module, allowing you to deliver data quality issue details directly into your enterprise pipelines.
-
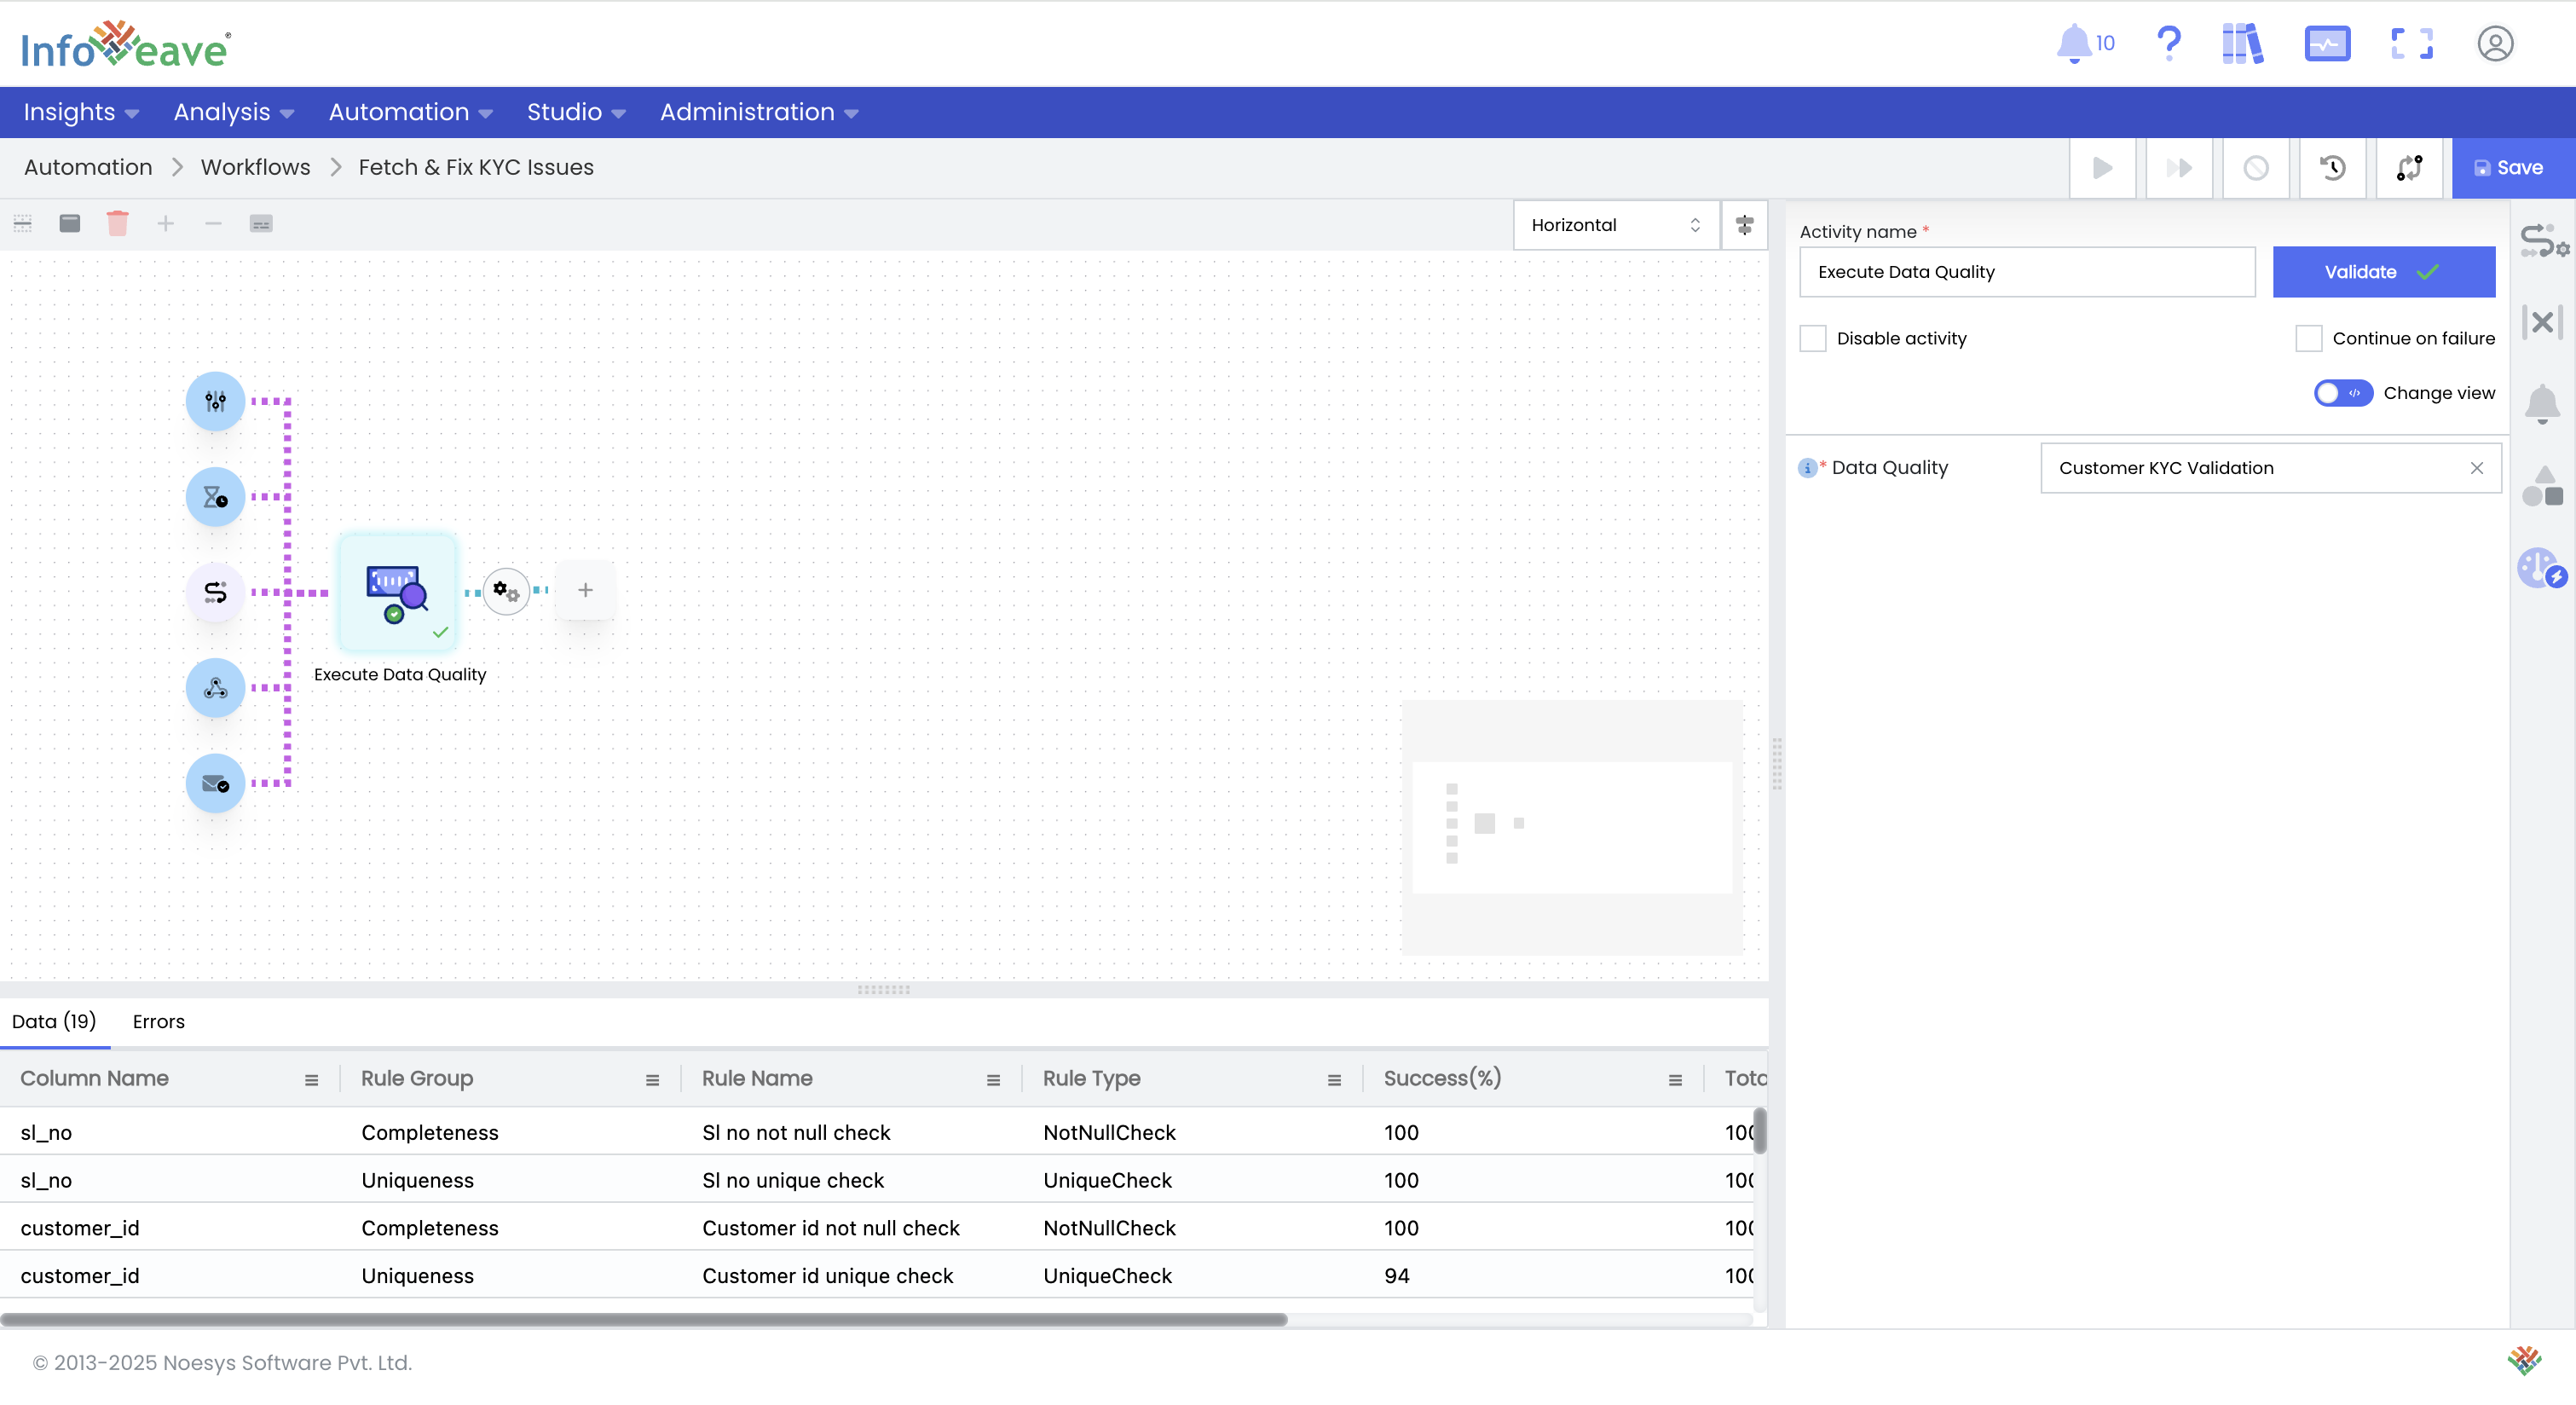
Add a Data Quality Step to a Workflow: Create an Infoveave workflow, add the Data Quality activity, and select your configured rule set. Validate the step to ensure the process runs correctly and produces the expected results.
-
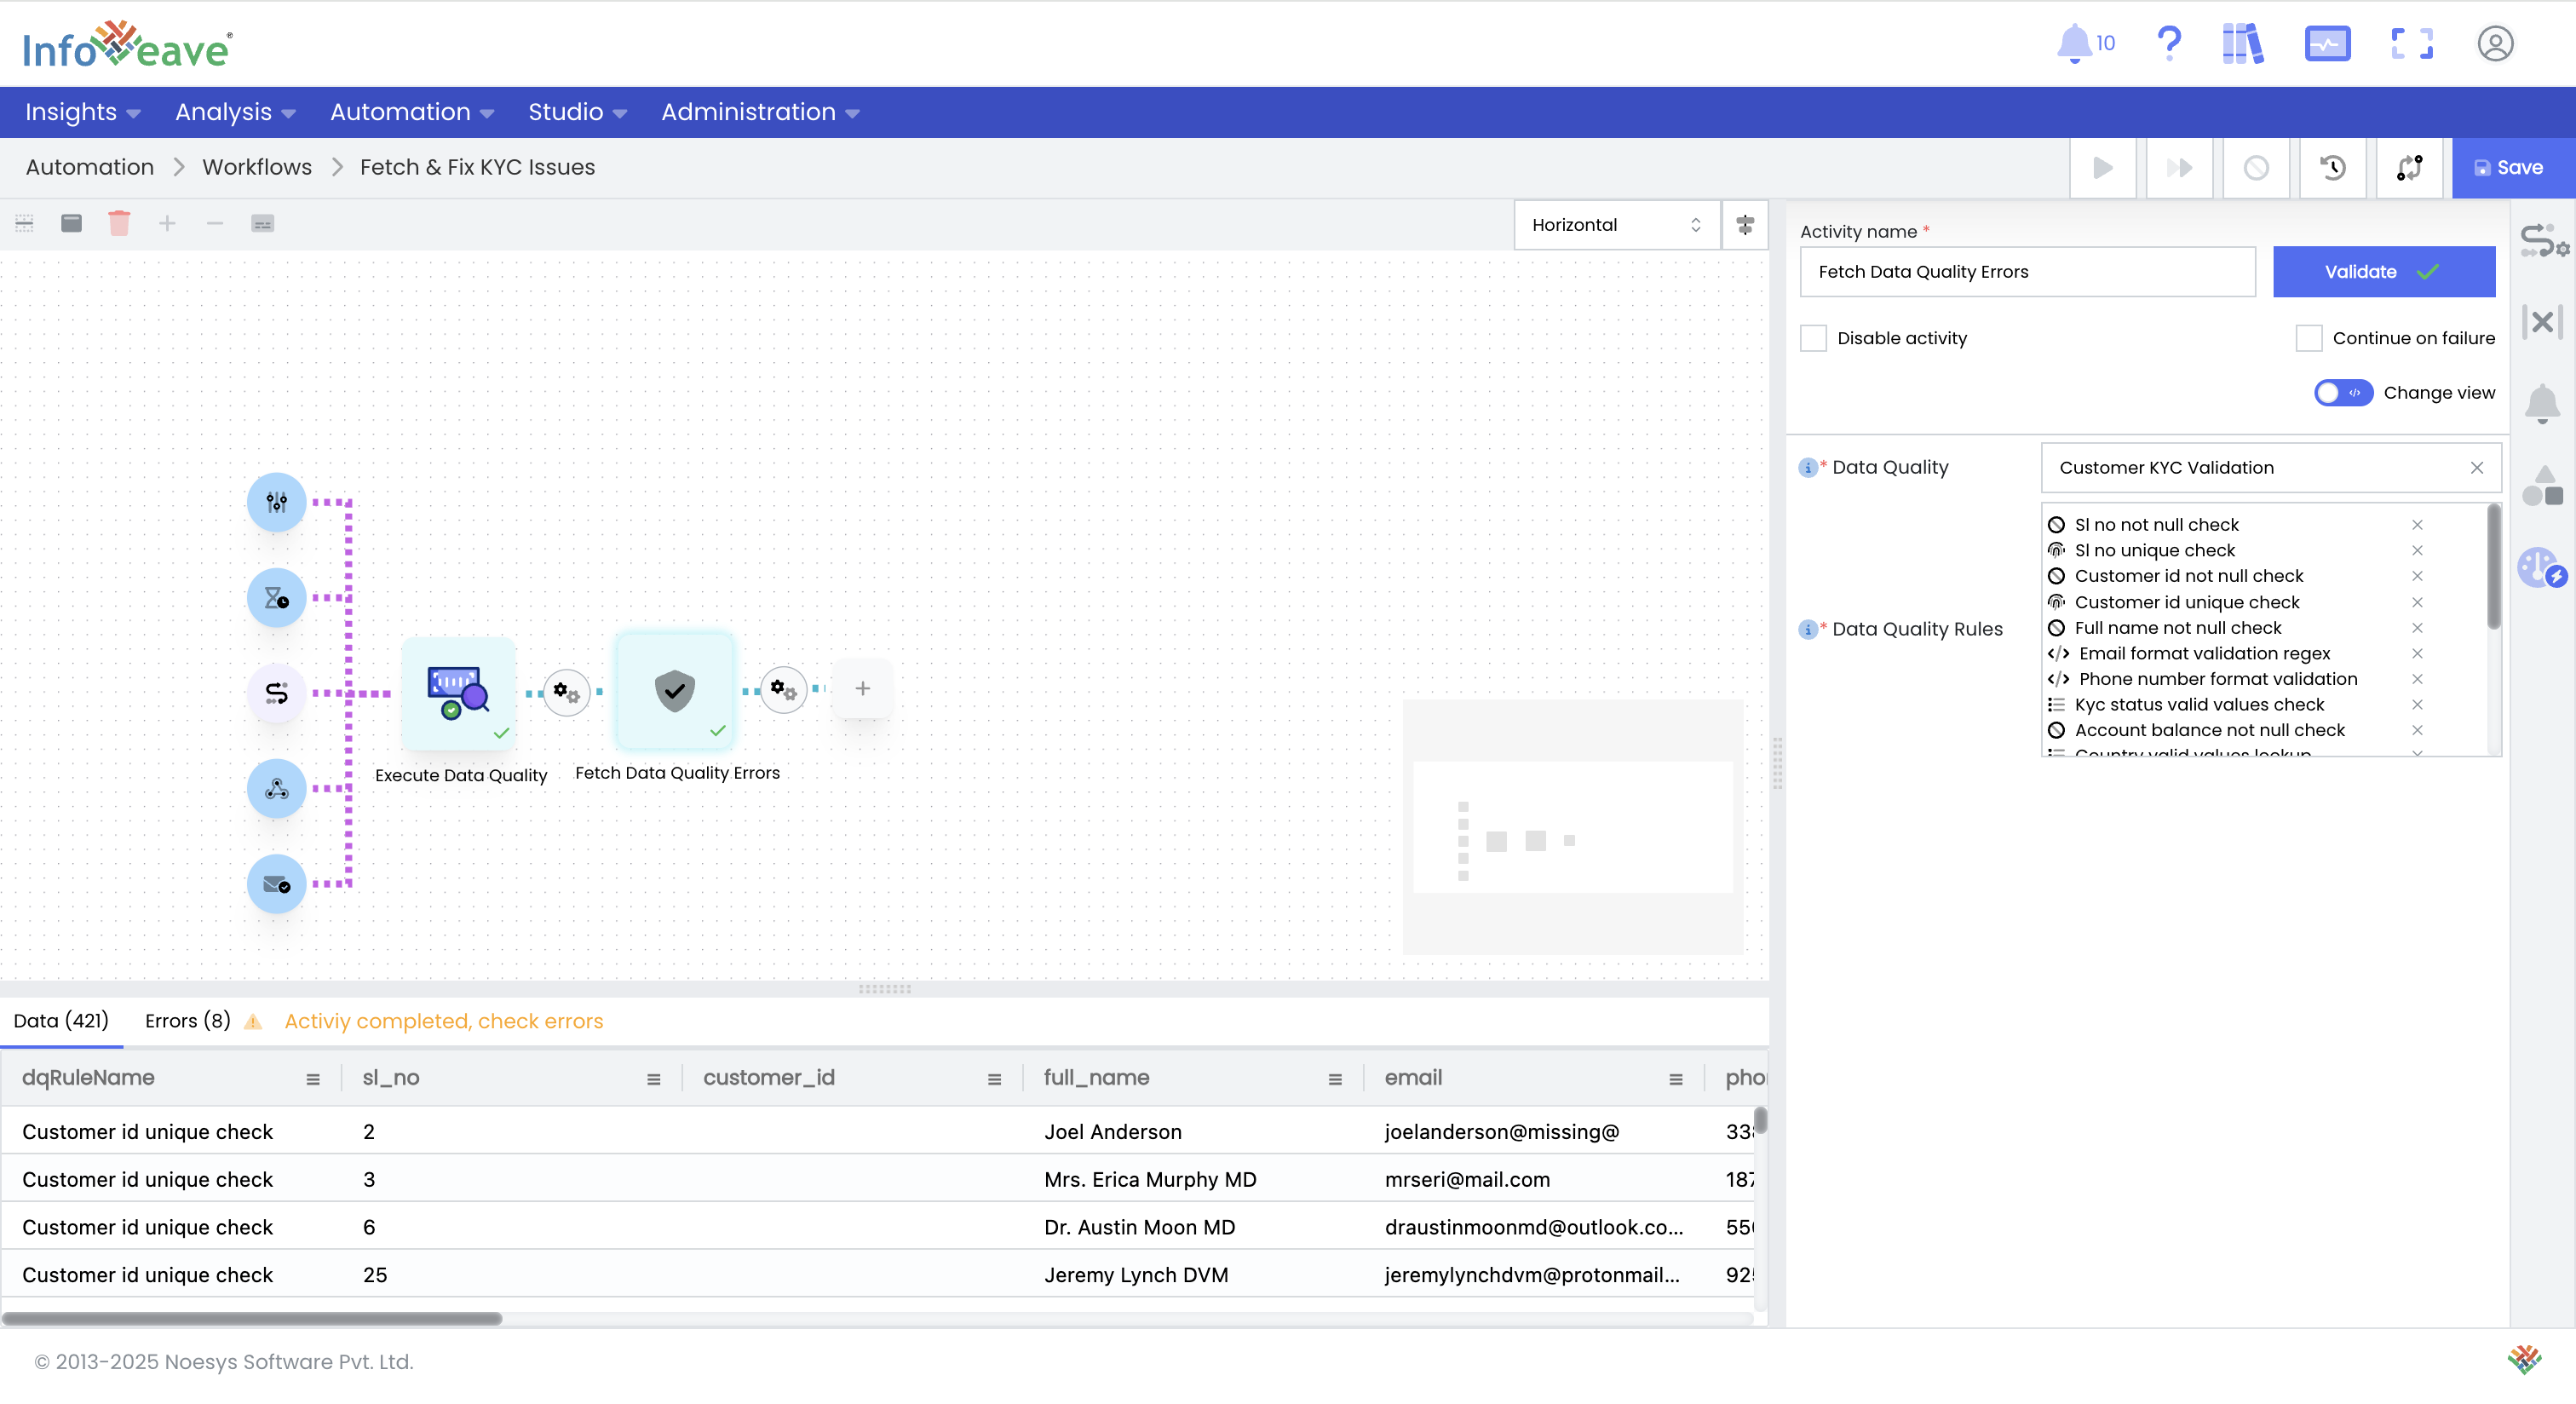
Fetch Data Quality Errors: Next, add the Fetch Data Quality Errors activity to the workflow. This activity retrieves only the rows that failed the data quality checks, tagged with relevant error information.
-
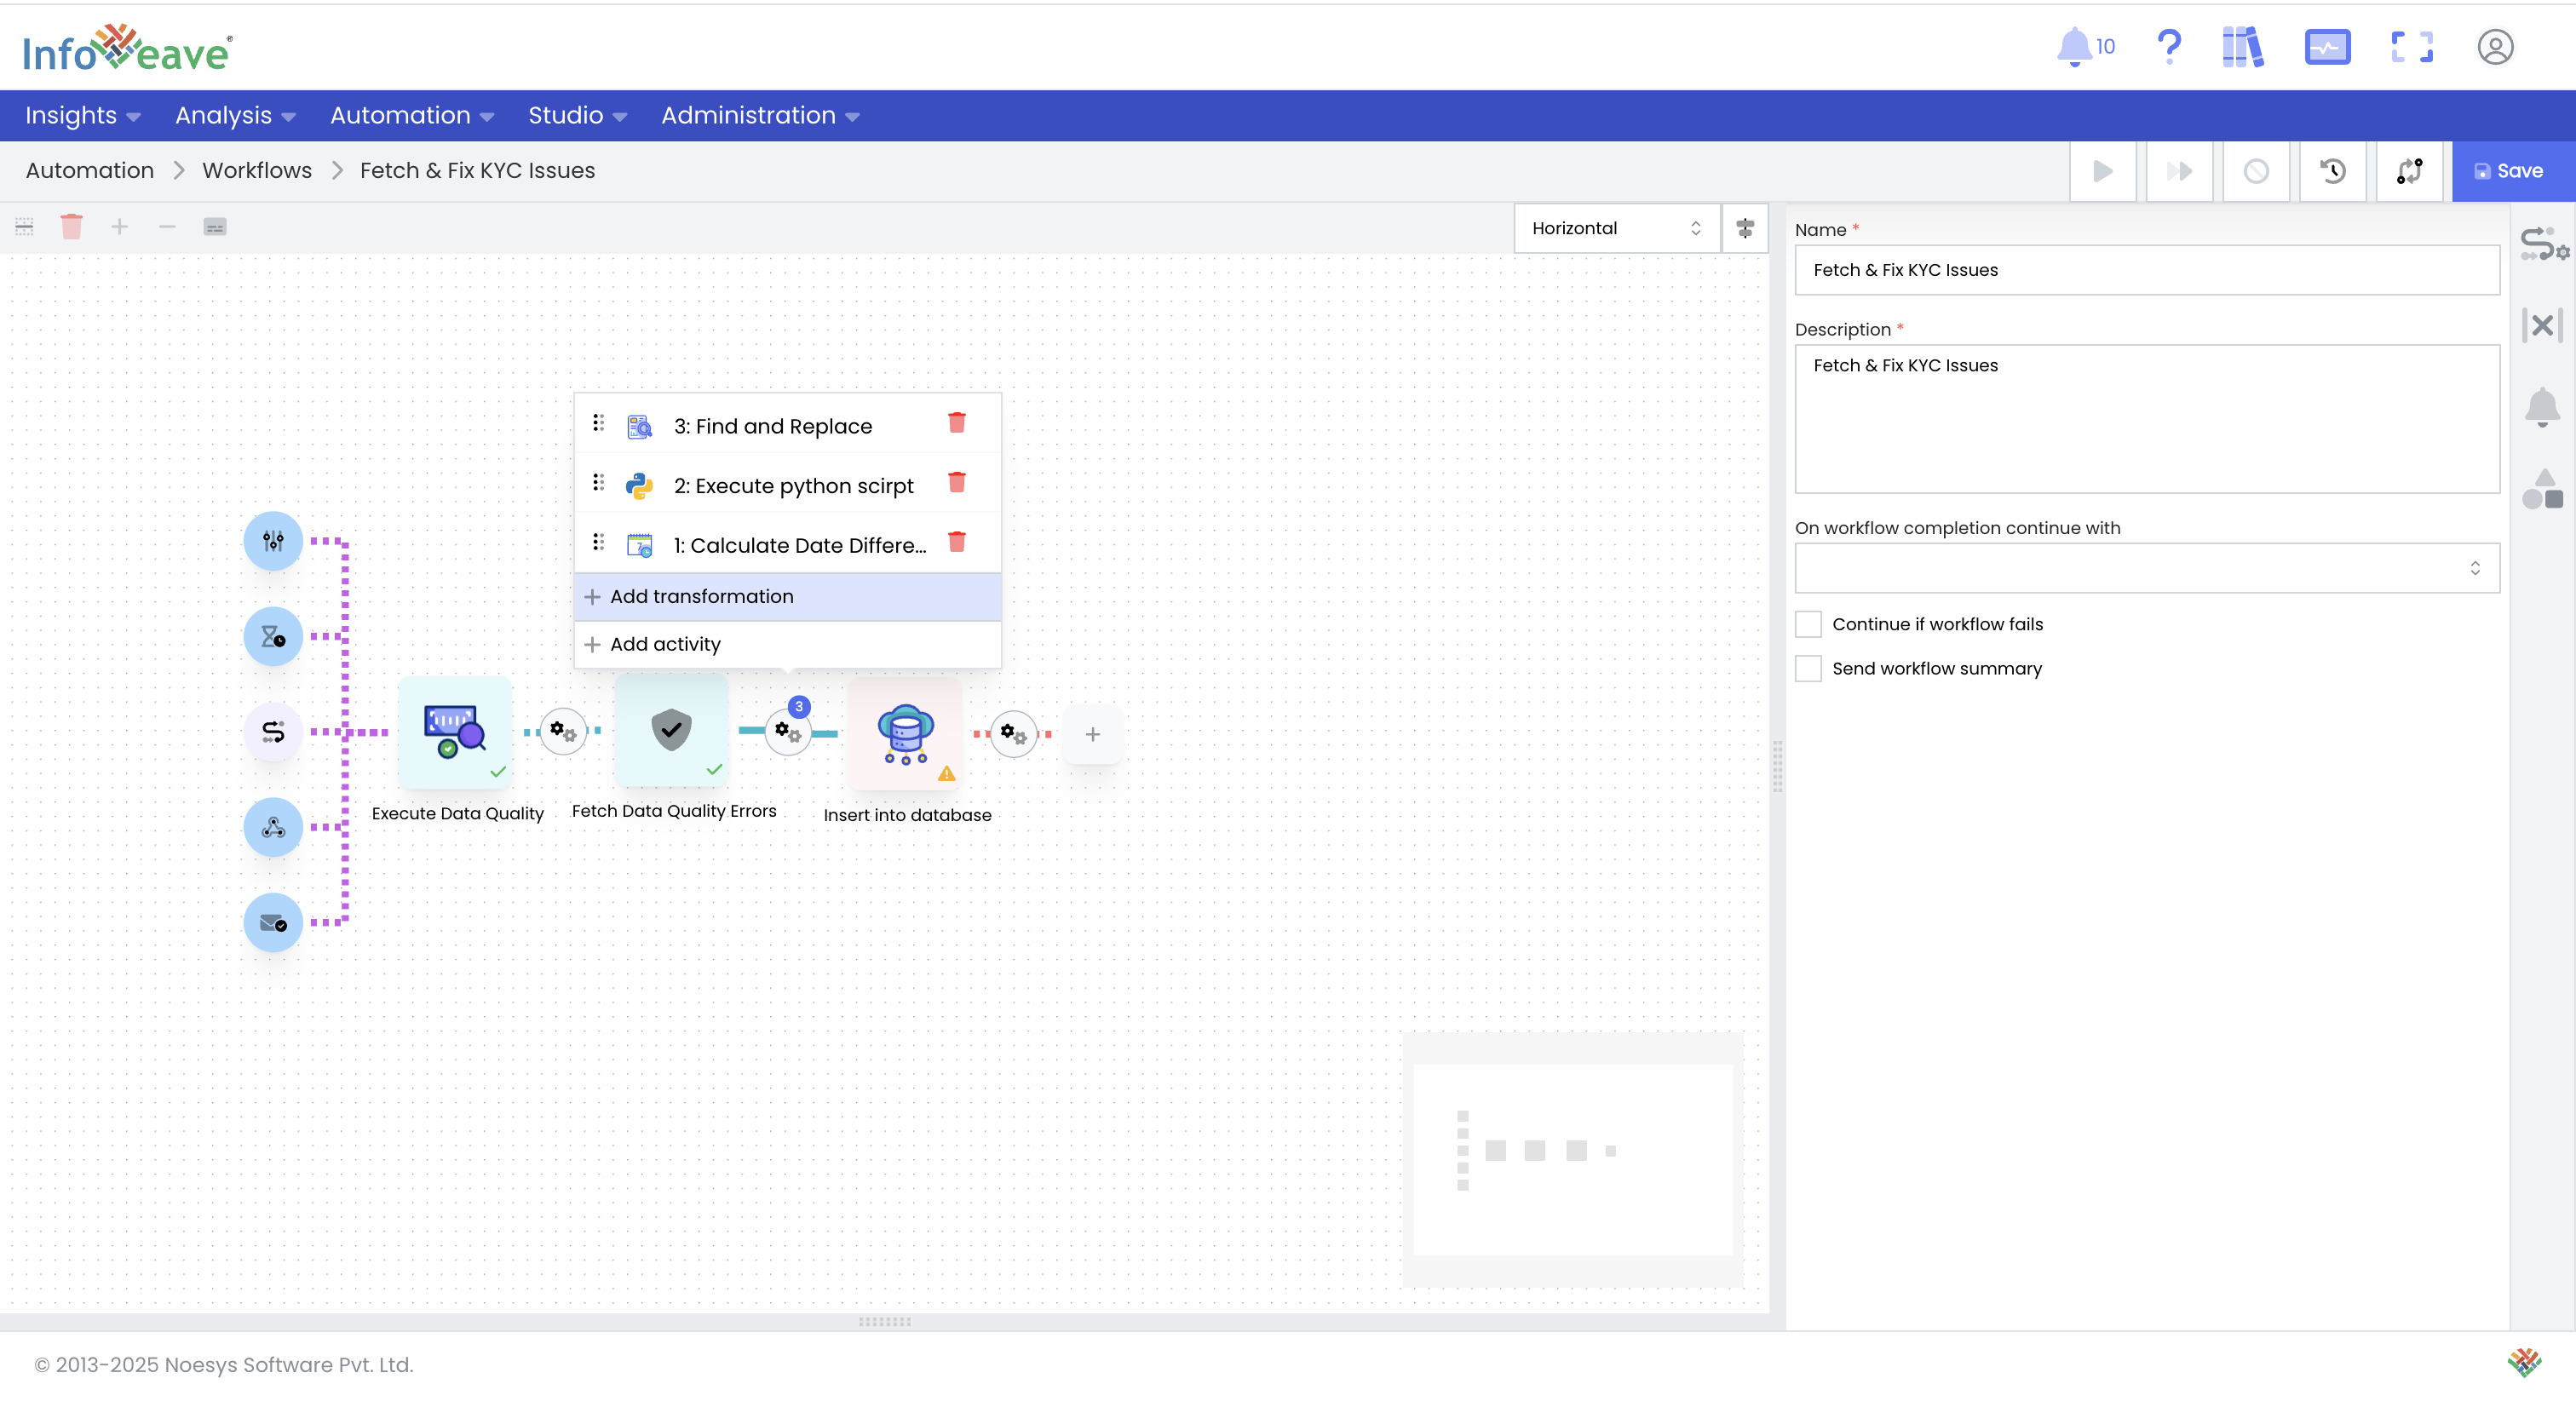
Route Errors for Processing or Remediation: This dataset of errors can be posted via API to any enterprise pipeline or uploaded to a database for further processing. Alternatively, Infoveave can fix the issues based on another set of rules and deliver the corrected data back to the enterprise pipeline.
You can invoke the entire workflow from a Webhook for a simple "fire-and-forget" execution.
Click here to learn more about creating webhooks for Infoveave activities.
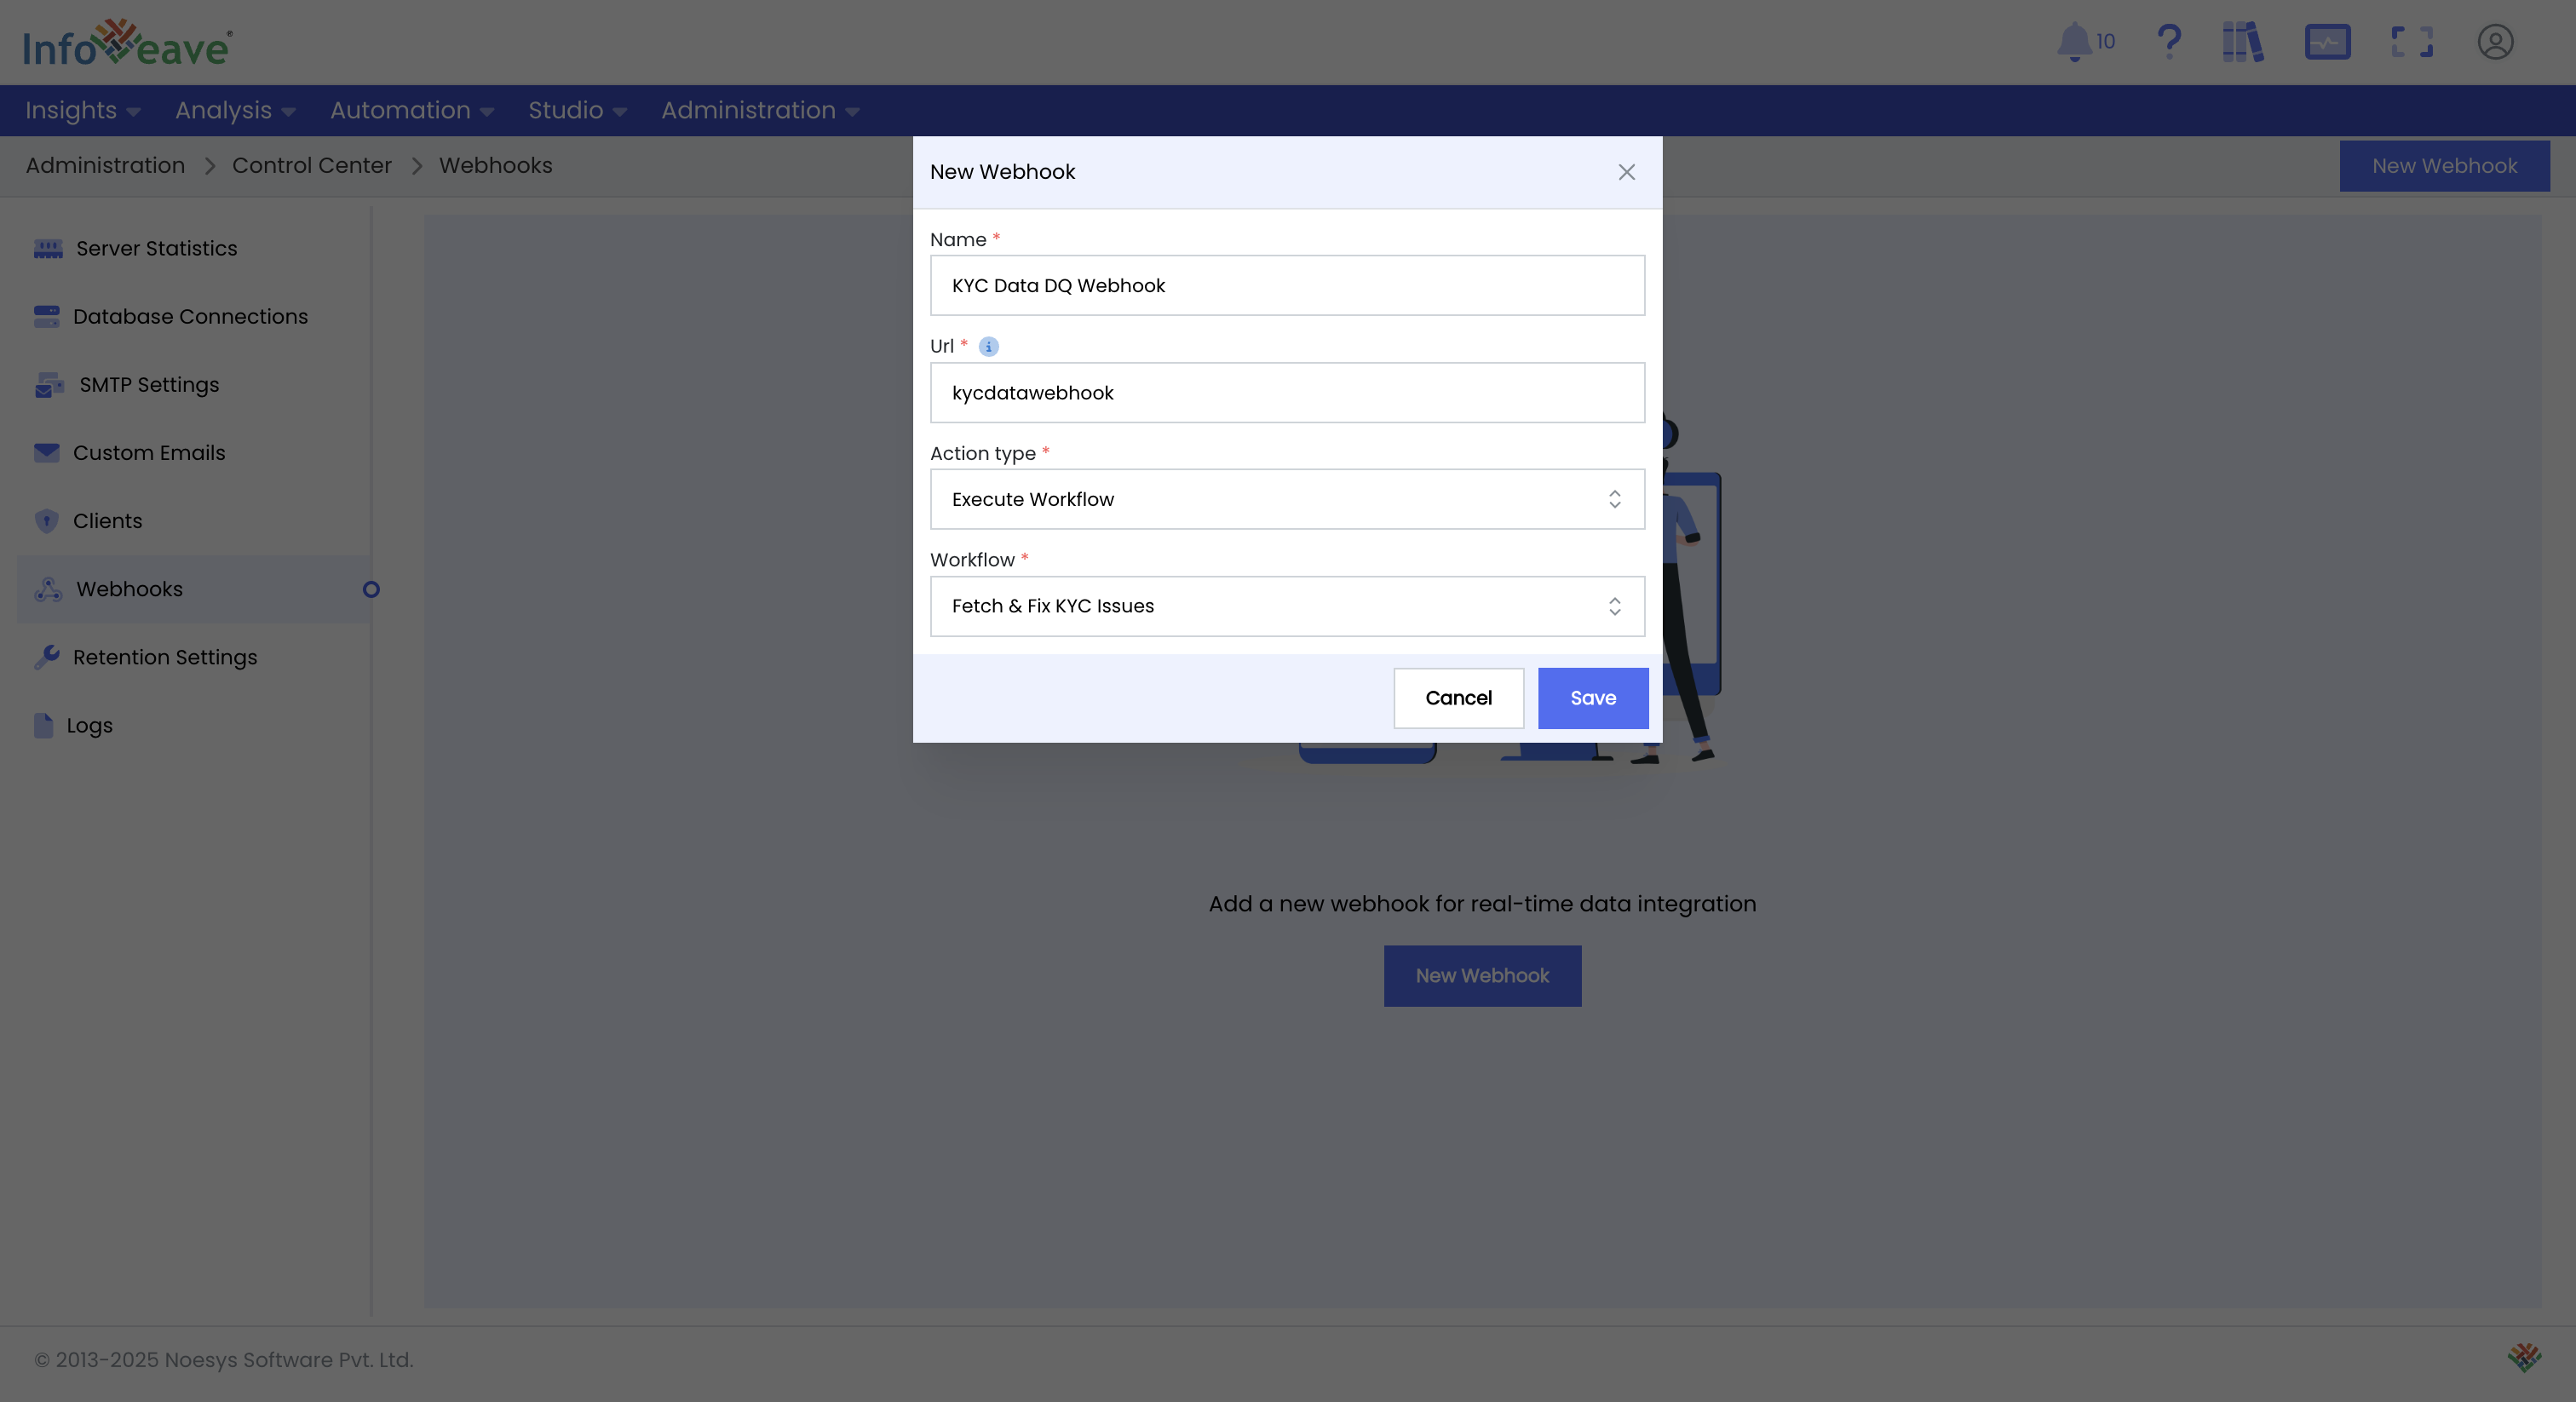
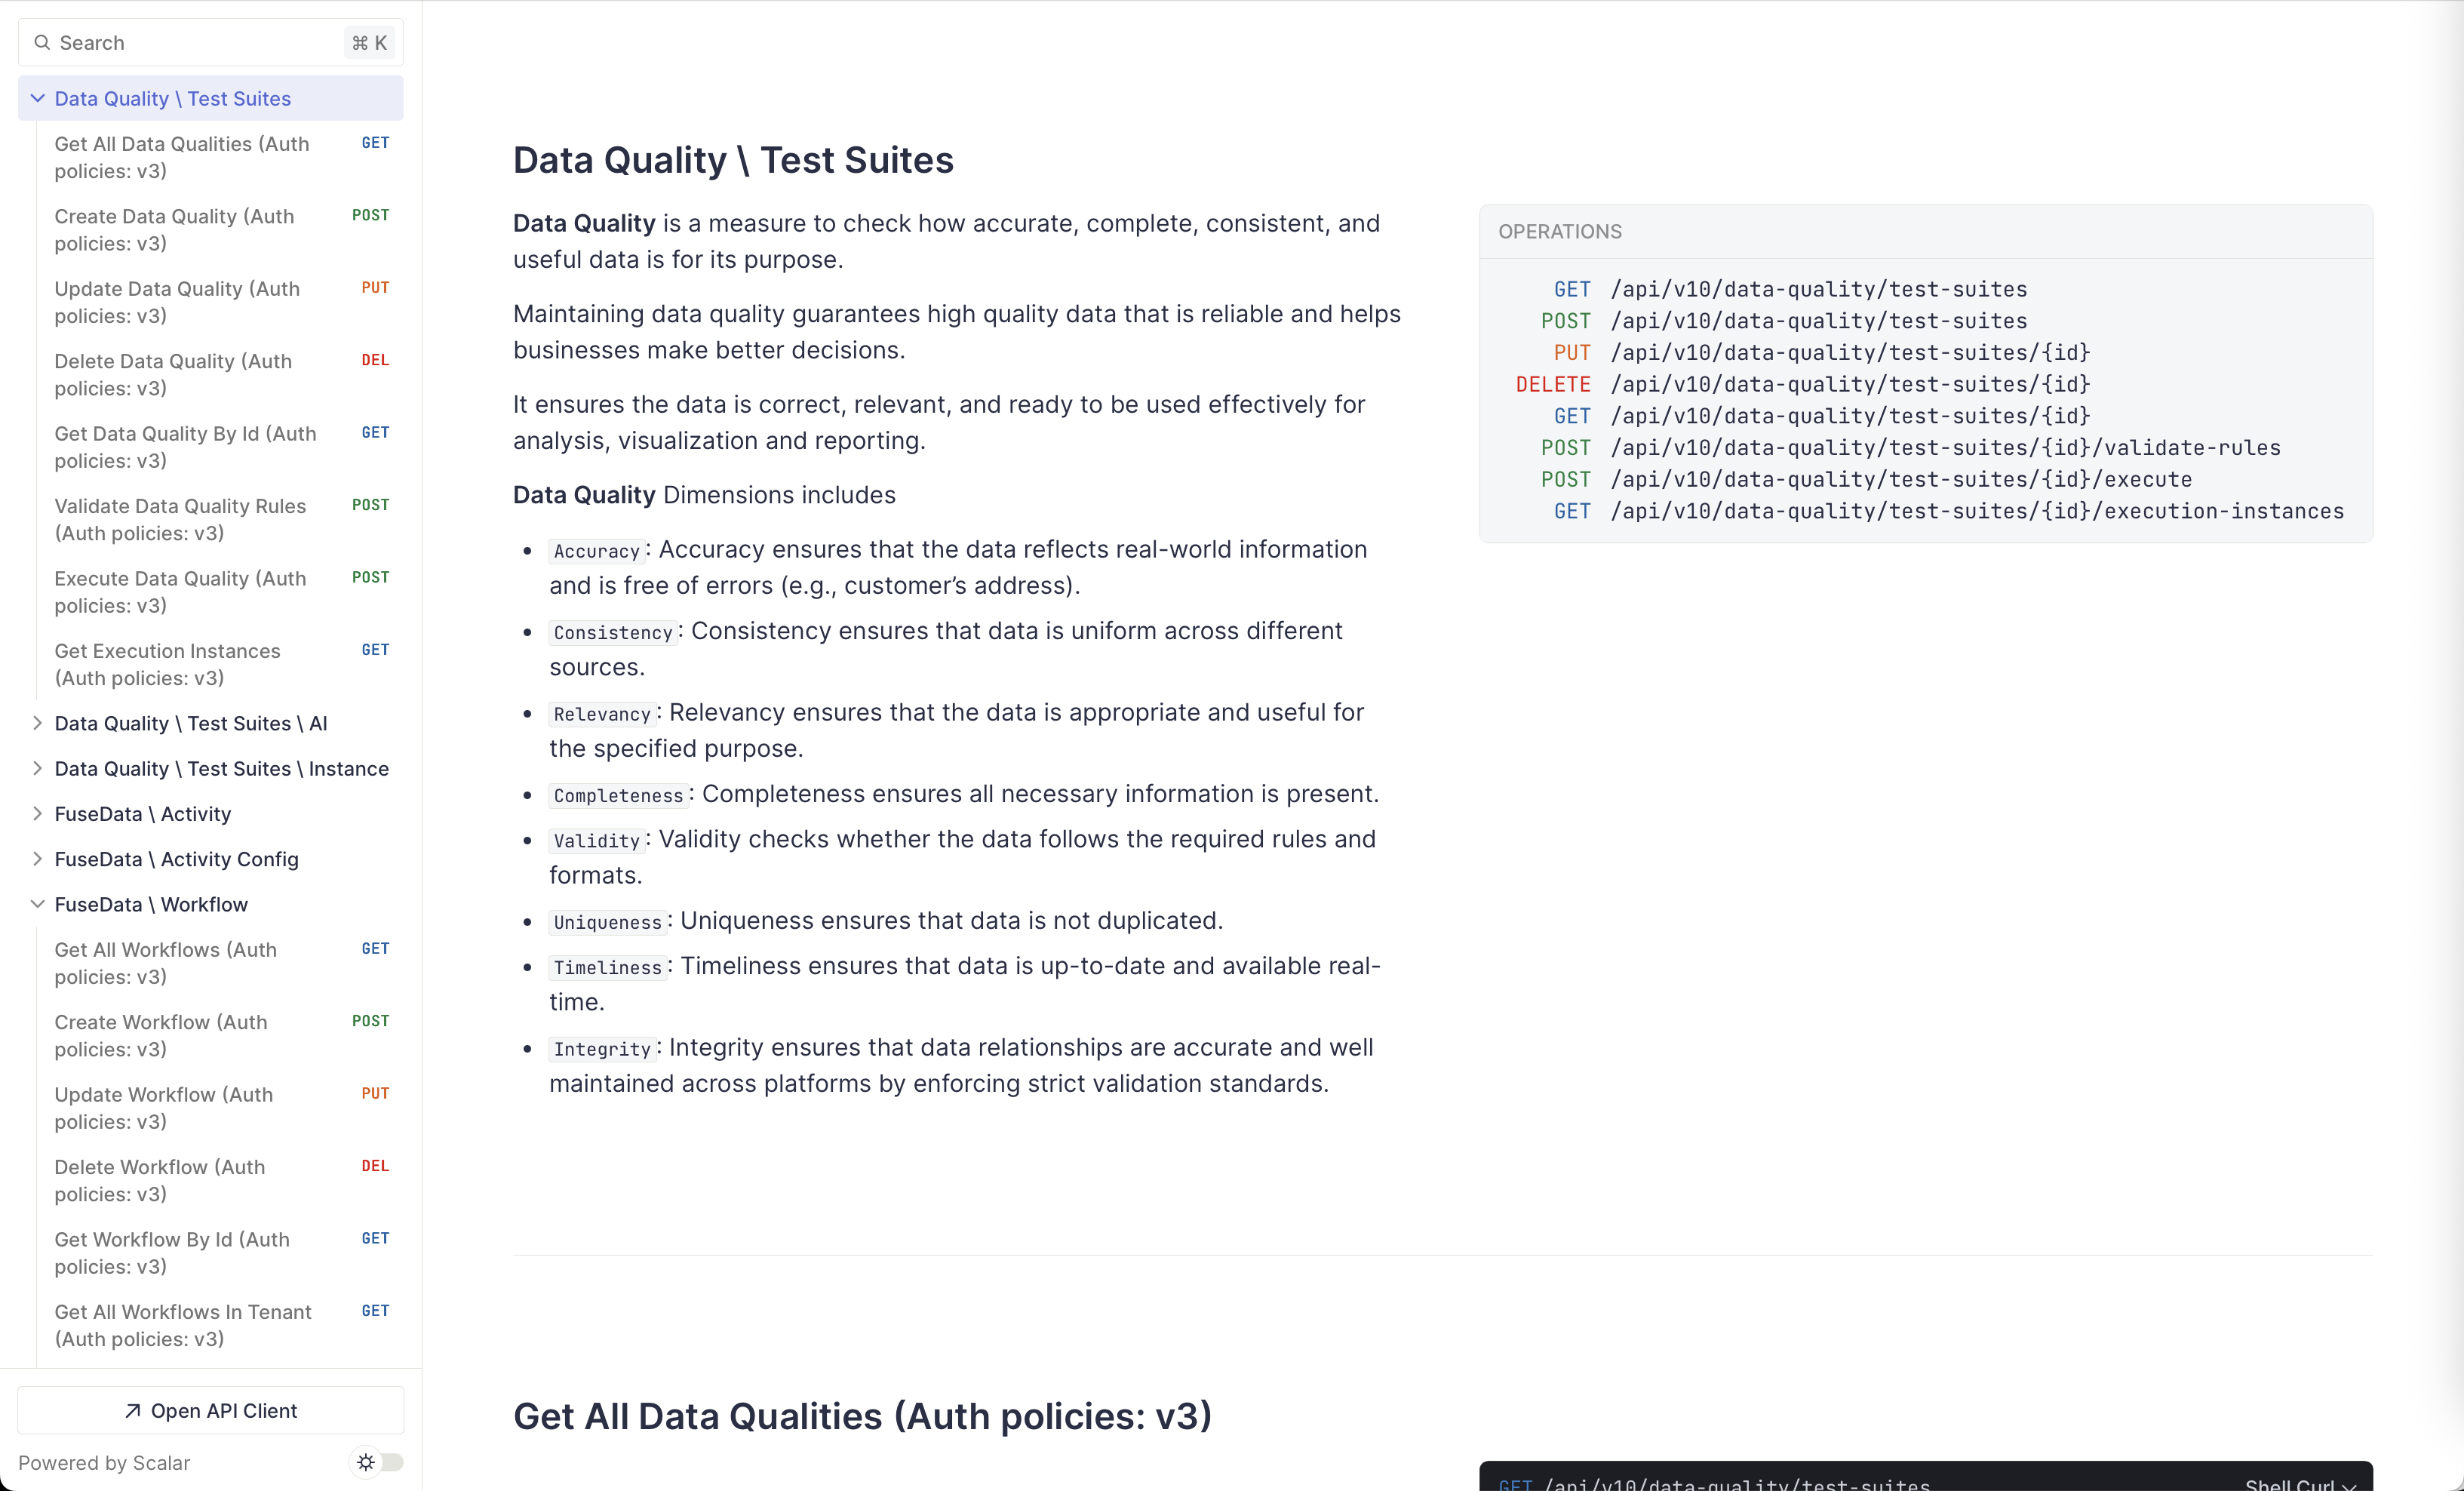
For a fully managed call that includes workflow status (errors, % complete, etc.), you will need to use the Infoveave Workflow APIs.
By enabling rule setup, GenAI-driven test creation, continuous monitoring, and seamless pipeline integration, Infoveave operationalizes data quality and embodies data observability to deliver reliable, trustworthy insights for your business.