Infoveave collaborates with Project Balance & Catholic Relief Services (CRS)

Ethiopia Joint Emergency Operation Program (JEOP)
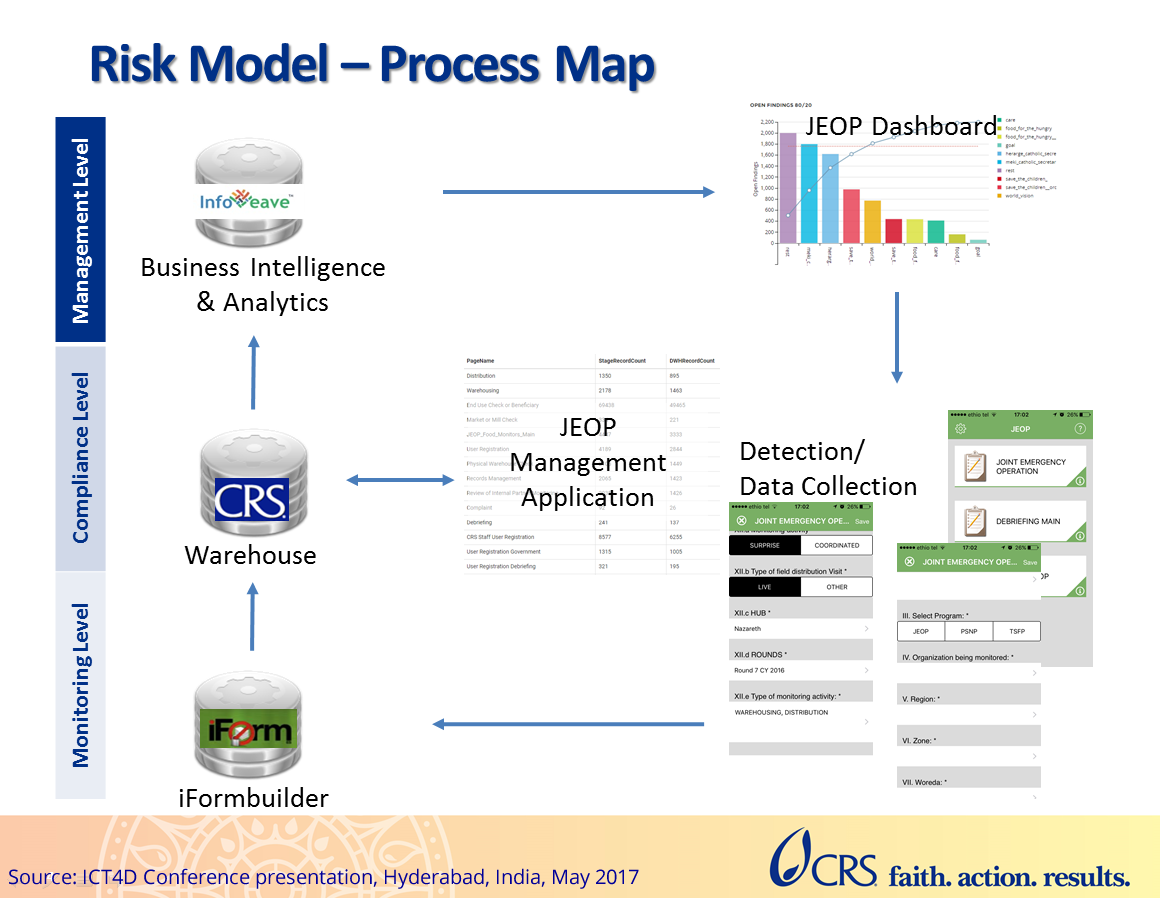
In an article published on ICTWorks.org, Catholic Relief Services (CRS) has highlighted the Joint Emergency Operation’s (JEOP) highly effective food monitoring program in Ethiopia. Millions of people are served by this initiative of food distribution, based on monitoring the last-mile data. To identify and manage risk and compliance variables such as warehouse and market location, warehouse management, and local distribution channels, field-based data was used to construct a risk management model. In addition to identifying social and environmental conditions like political unrest, community location, and other elements that may call for closer management of resources, CRS could use the risk index generated by the system to decide where to relocate personnel and other resources in order to proactively prevent losses. CRS hired Project Balance to create a system that pulls monitoring data gathered on tablets in the field, detects data discrepancies, offers a workflow for data approval, and shows risk and other monitoring data in a series of dashboards.
Contribution by Infoveave
CRS relied on the iFormBuilder cloud data repository to pull data from the field, which is then transformed and placed into a data warehouse. Additionally, data is validated and approved by the data management application. After then, the data was moved to the Infoveave – Data Intelligence Platform. The data was engineered, analyzed, and visualized over the Infoveave platform. The business intelligence tool Infoveave created a comprehensive dashboard system for administering the program by displaying a variety of data visualizations, such as maps, graphs, tables, and text widgets. The data was presented back to the management with insightful visualizations and in a clean and easy-to-understand manner.

About Infoveave
Infoveave® provides insights to stakeholders by transforming data into visual and actionable information. Users of Infoveave® can:
- Load data sources using an easy-to-use wizard.
- Create visual mashups from an array of interactive data visualization options.
- Perform analysis and correlations across many data sources.
- Carry out Competitor Analysis, Customer Analysis, MTD, YTD Trends Analysis.
- Track Operational Efficiency & Effectiveness Risk & Compliance.
- Simulate What-if scenarios, Forecast and Predict trends on large datasets.
- Build historical data, discover patterns, and gather deeper insights on demand.
- Share and collaborate with stakeholders and customers for quick action.